
Let’s start with something most people in the property industry would rather you didn’t know. That friendly person walking you through open homes on a Saturday morning — the one with the firm handshake, the market updates, the confident suburb recommendations — is legally working for the seller. A regular Real Estate Advice of an agent is to get the best possible outcome for the seller. Every suburb they suggest, every price guide they give you, every gentle nudge toward a particular property or postcode — all of it flows through that one uncomfortable fact.
They’re not your advisor. They just feel like one. But “good at their job” means good at getting results for sellers — not for you. And the moment you understand that distinction, you’ll start asking very different questions before you sign anything.
How Much Do Australians Actually Trust Real Estate Advice?
Before we get into suburbs and tactics, here’s a number worth sitting with. Just 7 to 9% of Australians rate real estate agents highly for ethics and honesty — making them the third least-trusted profession in the country (Roy Morgan Image of Professions Survey).
The Governance Institute of Australia’s 2025 Ethics Index gave agents a net trust score of negative 22% — the lowest of any of the ten mainstream professions measured. Near-universal distrust. That gap between the two is where a lot of Melbourne buyers quietly lose money.
The Trust Gap — What the Data Shows
| Metric | Figure |
| Australians rating agents highly for ethics | 7–9% — 3rd lowest profession |
| Governance Institute net trust score | −22% — lowest of 10 professions |
| Year-on-year change in agent trust | −4 points from 2024 |
| Buyers who used an agent in 2025 | 91% |
| Average Victorian agent commission | 1.6–2.5%, avg ~2.1% of sale price |
| Developer OTP marketing commission | 10–15% of purchase price |
Source: Roy Morgan | Governance Institute of Australia | Securexchange/InfoTrack | WhichRealEstateAgent
That differential — 2.1% for selling someone’s established house versus 15% for selling you a developer’s apartment — is the single most important number in understanding why certain recommendations get made.
Part A: What Gets Pushed vs What Actually Performs?
Agent Push #1: Off-the-Plan Apartments
BIS Oxford Economics conducted an eight-year study of off-the-plan apartment resales in Melbourne. Their findings: 66% of off-the-plan resales made no price gains or actively lost money. The average aggregate return across all OTP resales was negative 2.7%. Over the same period, established apartment buyers in Melbourne averaged a positive 7.4%. Established house buyers averaged significantly more.
10-Year Capital Growth Comparison — Melbourne Property Types
| Property Type | 10-Year Growth | Agent Commission Incentive |
| Established houses | +80.2% | Standard 2.1% |
| Established units | +37.7% | Standard 2.1% |
| Off-the-plan apartments | −2.7% average | Developer commission 10–15% |
The gap between the agent-recommended product and the data-backed alternative: 83 percentage points.
And it’s getting worse, not better. In the City of Melbourne LGA — the CBD, Docklands, and Southbank — 40.7% of all dwelling resales in the December 2024 quarter sold at a nominal loss (Cotality/FVG Property). The average loss-making seller had held for nearly ten years. In the same quarter, 22.5% of all Melbourne unit resales recorded a loss (Cotality Pain & Gain, June 2025).
Real Estate Advice vs Reality
| Suburb | What Agents Say | What the Data Shows |
| Docklands (3008) | “Strong yield. CBD lifestyle.” | Flat-to-negative values for a decade. 40.7% of resales at a loss. |
| Box Hill (3128) | “SRL station coming. Strong demand.” | 504 unsold apartments. Banks cap lending at 70–80%. Oversupply kills the infrastructure story. |
| Southbank (3006) | “Premium rents. Great yields.” | OC fees up to $12,000/year quietly erase the yield. Among Melbourne’s highest loss rates. |
Source: Charter Keck Cramer 2025 | Cotality Pain & Gain Reports | Urban Property Australia Q2 2025 | NAB Melbourne Market Insights Feb 2026
“But what about the stamp duty concession?”
Victoria’s expanded off-the-plan stamp duty concession (October 2024 to October 2026) saves the average buyer approximately $24,517 (Property Update). That’s real money. But BIS Oxford’s data shows OTP apartments underperform established housing by approximately 2 to 5% per year. On a $620,000 apartment, even a 2% annual growth shortfall costs $12,400 in year one alone.
Real Estate Advice #2: Why Do So Many Agents Push Outer Suburbs and New House-and-Land Packages?
The second most common push from agents with developer relationships is the house-and-land package. Tarneit. Melton. Craigieburn. Donnybrook. Rockbank. The pitch runs something like: affordable entry point, brand new home, government grants, great depreciation, “get in before the area takes off.”
What agents often don’t mention: referral fees from developers estimated at $5,000 to $10,000 per deal are embedded in the fixed package price (Anna Porter, Suburbanite). That’s before the developer’s own marketing margin.
Land Content vs Agent Commission — The Pattern
| Property Type | Land Ratio | Growth | Agent Earns |
| OTP apartment – CBD tower | 5–15% | Poor | 10–15% |
| New house & land: outer suburb | 30–50% | Limited | $5K–$10K referral |
| Established unit (small complex) | 40–60% | Moderate | 2.1% |
| Established house (middle-ring) | 65–80% | Strong | 2.1% |
Source: Property Planning Australia | Crest Property Investments | Microburbs | NextHouse analysis
See the pattern? The products that carry the lowest land-to-asset ratios — and therefore the weakest long-term growth fundamentals — are precisely the ones where agent commissions are highest.
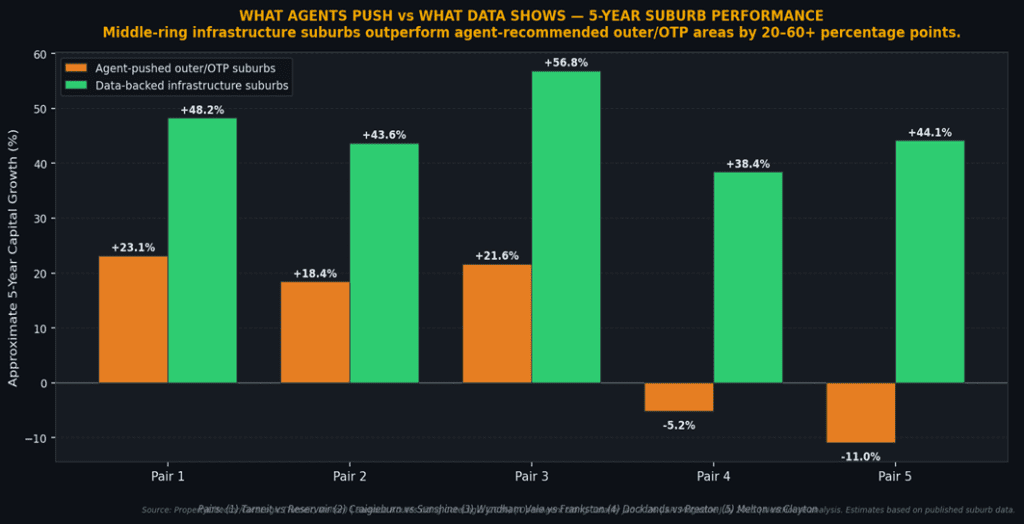
What does the outer suburb data actually shows?
Tarneit’s 10-year compound annual growth rate sits at approximately 4.3% (PropertyDirector/CoreLogic). Over a comparable period, Reservoir delivered 8–12% CAGR driven by confirmed level crossing removals and inner-north gentrification.
The outer suburb pitch depends entirely on infrastructure arriving on schedule. The data shows it often doesn’t — or arrives years late, by which point the buyer has been sitting on a depreciating building in a low-land-value suburb for half a decade.
Part B: What Happens in the Transaction?
Real Estate Advice Tactic #1: Underquoting
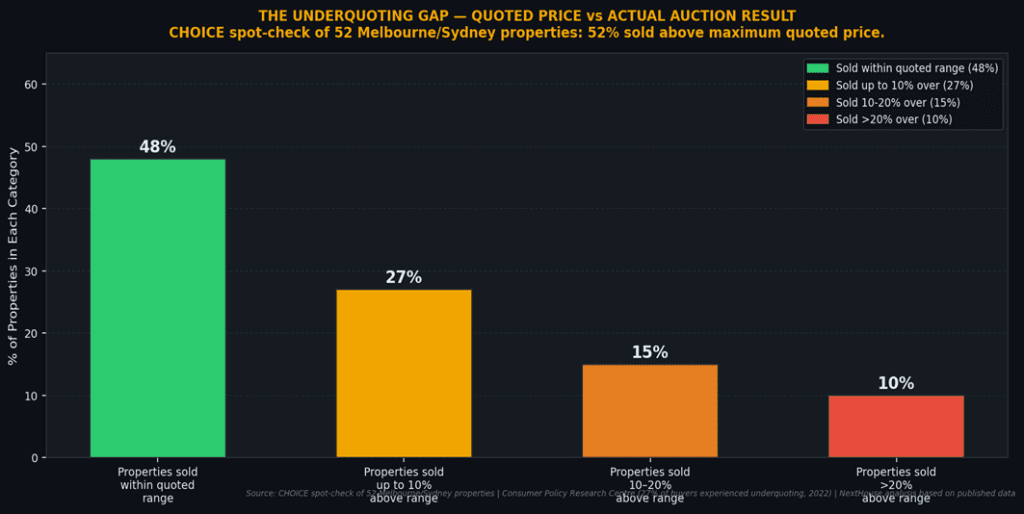
The Consumer Policy Research Centre’s 2022 survey found 27% of Melbourne buyers believed they experienced underquoting in their most recent transaction. The most extreme documented case: a Barry Plant Manningham property listed with a $1M–$1.1M guide sold for $1,538,000 — 40% above the top of the quoted range, triggering criminal charges.
So what can you actually do about real estate advice?
Before you set foot at any auction, pull the comparable sales yourself. SQM Research and CoreLogic both give you access to the same data the agent is using — so there’s no reason to walk in blind.
And whatever price range gets quoted to you — mentally add 10 to 20% on top of the upper figure. That’s the typical underquoting gap documented by the Consumer Policy Research Centre. Not occasionally. Consistently.
Real Estate Advice Tactic #2: Are Auctions Actually Better for Buyers — or Just for Sellers?
Melbourne is Australia’s auction capital. And agents love them — because peer-reviewed research (Frino et al., 2010) found auction homes command a 3 to 15% premium over comparable private treaty sales. Melbourne-specific data showed an average premium of $19,326 after controlling for property characteristics.
Auction vs Private Treaty — What Buyers Need to Know?
| Feature | Auction | Private Treaty |
| Cooling-off period | None | 3 business days |
| Finance conditions | Not allowed | Can be included |
| Building inspection | Before auction | Can be a purchase condition |
| Days on market | ~25 days | ~37 days |
| Buyer protection | Minimal | Significantly higher |
Source: Commonwealth Bank | Farrar Gesini Dunn | REIV auction data | Bamboo Routes Melbourne 2025 | NextHouse analysis
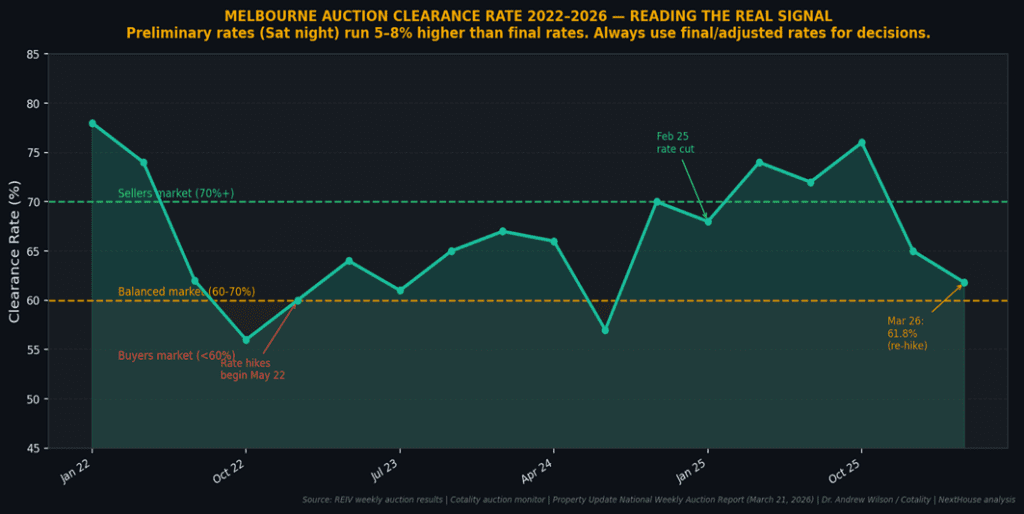
How to read clearance rates correctly?
Below 60% = buyer’s market — you have genuine negotiating power. 60–70% = balanced — neither side dominates. Above 70% = vendor’s market — competition is fierce.
Critical caveat: preliminary Saturday-night rates run 5 to 8% points higher than final adjusted rates, because unsold properties take days to be reported. Always use the final weekly REIV figure — never the Saturday night number that gets splashed across news sites.
Real Estate Advice Tactic #3: Who Is the Agent’s Building Inspector, Broker and Conveyancer?
Beyond commissions, agents control a referral pipeline — to conveyancers, mortgage brokers, building inspectors, and financial planners. Every referral in that chain can carry a hidden fee.
The Hidden Referral Fee Network
| Who Gets Referred | What the Agent Gets | What You Risk |
| Building inspector | Undisclosed referral fee | Inspector who won’t kill the deal — even when they should |
| Conveyancer/solicitor | $500–$1,500 per referral | Someone whose next job depends on the agent, not you |
| Mortgage broker | $500–$2,000 trail commission | A loan that suits the relationship, not your finances |
| OTP apartment sale | 10–15% of purchase price | A cost you can’t see, can’t negotiate, and can’t remove |
Source: ABC News August 2023 | HWLE Lawyers | Consumer Affairs Victoria | The Urban Developer | Deakin/Griffith University building audit
The building inspector point deserves particular attention. A Deakin/Griffith University audit of 212 Victorian multi-residential buildings found 74% had defects, with an average of 14 defects per building and average repair costs of $331,829 per building (NSW Building Commission, 2023).
Real Estate Advice Tactic #4: Manufactured Urgency
RMIT University’s Dr. Khezr has published research identifying the specific cognitive biases that agents exploit in Melbourne property transactions. Herding behaviour — underquoting attracts crowds that signal desirability. Money illusion — citing nominal price data (“this suburb doubled in 10 years”) without inflation adjustment. Selective data disclosure — reporting above-expectation results while quietly omitting disappointing ones.
Victoria’s Section 32 Vendor Statement is mandatory — it must include zoning, planning overlays, building permits, and outgoings. But as conveyancing firms consistently note: what it omits is the buyer’s responsibility to investigate. NBN quality, surrounding development plans, flood overlay implications — none of this is volunteered unless you ask.
How Do You Check Whether an Real Estate Advice Actually Stacks Up?
The information gap is real. But it’s not insurmountable. Every data point an agent uses internally is available to buyers — often at low cost.
Your Independent Verification Toolkit
| Step | What to Do | Cost |
| Comparable sales | Pull your own from CoreLogic or Pricefinder | $30–$139/mo |
| Vacancy rates | SQM Research — above 3% = oversupply warning | $29.95/mo |
| Land-to-asset ratio | land value to purchase price: target 50%+ | Free |
| Clearance rates | Use final weekly REIV rates only | Free |
| Building inspection | Hire your own inspector — never the agent’s referral | $350–$650 |
Source: CoreLogic | SQM Research | Property Planning Australia | REIV | Deakin/Griffith University | NextHouse analysis
How to Tell a Quality Agent from a Conflicted One?
Not every agent operates at the margins of the enforcement data. Consumer Affairs Victoria’s 160+ fines over three years, while significant, represent a small fraction of Melbourne’s 3,000+ licensed agencies. Here’s how to tell the difference in practice.
Green Flags vs Red Flags
| Quality Agent | Conflicted Agent |
| Comparables are genuinely like-for-like — same size, age, location | Comparables are always smaller, older, or suspiciously far away |
| Can clearly explain the quoted price range with evidence | Deflects with vague “market sentiment” when pressed |
| Independent building inspection — their referral is optional | Creates friction if you want your own inspector |
| Discloses referral arrangements in writing | Can’t produce written disclosure when asked |
| Shares full campaign data — including pass-ins and reductions | Only shows the good news. Never the bad. |
| Accepts building inspection conditions without fuss | Pushes hard toward unconditional auction every time |
Source: Consumer Affairs Victoria | CHOICE buyer protection guide | Sharrock Pitman Legal | NextHouse analysis
Conclusion
Real estate agents aren’t villains. Most of them work hard and know their markets well. But the incentive structure they operate within is real, documented, and produces predictable patterns. That doesn’t mean every recommendation is conflicted. It means every recommendation deserves to be cross-checked against independent data before you act on it.
The five-step verification framework in this article gives you exactly the tools to do that. None of it requires an economics degree. All of it is available to any buyer willing to spend an hour checking before they spend a lifetime paying.
Want independent suburb data for any Melbourne postcode? The NextHouse suburb intelligence dashboard tracks historical growth, vacancy rates, land-to-asset ratios, and infrastructure commitments across Greater Melbourne — updated every month. No agent spin. Just the numbers.
FAQs
- Do Melbourne real estate agents legally have to act in my interest as a buyer?
No — and most people don’t realise this. A vendor’s agent’s legal duty runs to the seller, not you. They are literally the other side’s professionals. The only person in the transaction legally obligated to work for you is a buyer’s agent — someone you hire and pay yourself. - How much commission does a real estate agent make in Victoria?
On a typical Melbourne property, that’s about $17,350. But for off-the-plan apartments, agents can pocket a developer marketing commission of 10–15% of the purchase price — invisibly baked into what you pay, never shown on the contract. - What % of Melbourne apartments actually sell at a loss?
More than most people expect. Nearly 41% of dwellings resold in Melbourne’s CBD, Docklands, and Southbank sold at a loss in the December 2024 quarter. Across all Melbourne units, 22.5% recorded a loss in March 2025. A BIS Oxford Economics study found 66% of resales either made nothing or lost money — with an average return of negative 2.7%. - What does the Melbourne auction clearance rate actually mean for me?
It tells you who holds the power. Below 60% — you do. Between 60–70% — it’s roughly even. Above 70% — the seller does. One important catch: Saturday-night preliminary figures run 5–8 percentage points higher than final adjusted rates. Always use the weekly REIV final number. As of 21 March 2026, Melbourne sits at 61.8% — balanced, leaning slightly in buyers’ favour. - What is the land-to-asset ratio and why should I care?
Aim for 50% or above — ideally 65–80% for an established house. Off-the-plan apartments in towers often sit at just 5–15%. New house-and-land packages in outer corridors land at 30–50%. Both carry the highest commissions. Neither carries the best fundamentals.
Disclaimer: This report is for educational and informational purposes only. It does not constitute financial, investment, or legal advice. Always seek professional advice before making property decisions.