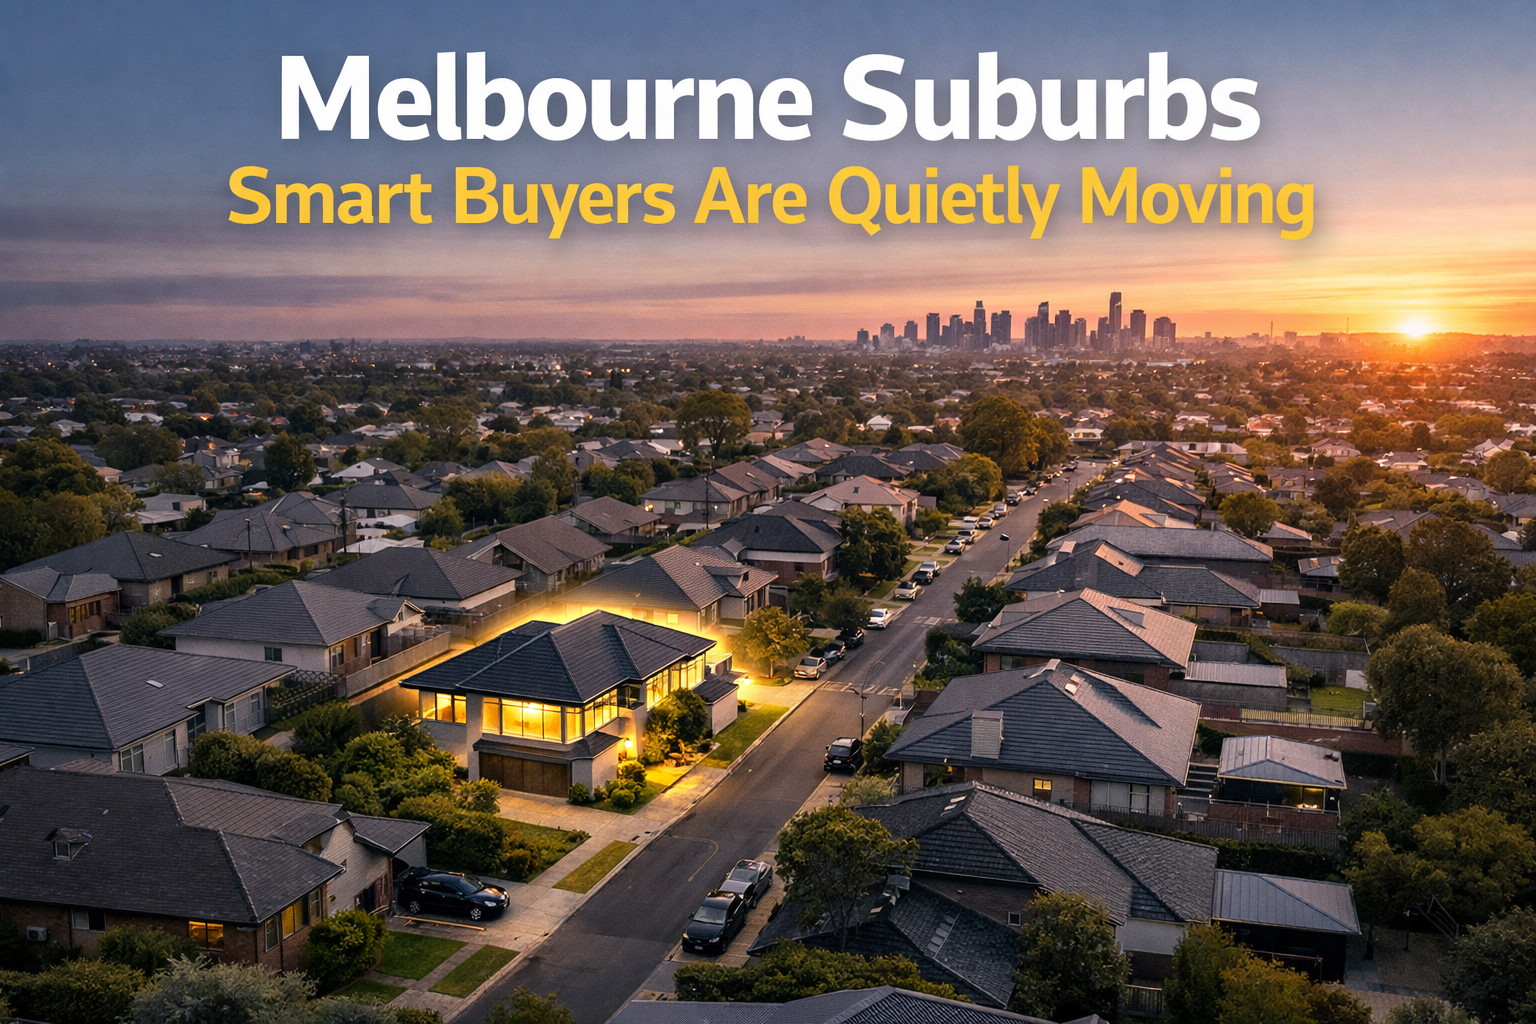
There’s a quiet shift happening in Southeast Melbourne’s property guide market — and most people haven’t caught on yet. The inner suburbs have largely stalled. The city’s headline numbers look flat. But head southeast, and you’ll find a corridor that’s doing something genuinely different. Frankston is growing faster than almost any suburb in Melbourne right now. Cranbourne just got direct CBD access through the Metro Tunnel — not a future promise, an actual done deal. And Pakenham is delivering the strongest rental yields of the three, with a greenfield development pipeline behind it that’s going to look very different in ten years than it does today.
Now, if you’re waiting for the part where we tell you to just buy something because prices only go up — that’s not this. And these suburbs aren’t monoliths — not every street is performing, not every property guide type is moving, and not every price point tells the same story.
The Three Suburbs Side by Side: Southeast Melbourne
Before we go deep on each suburb, here’s the full picture in one table. Save this — it’s the most useful summary you’ll find anywhere.
Southeast Melbourne — Core Property Data, April 2026
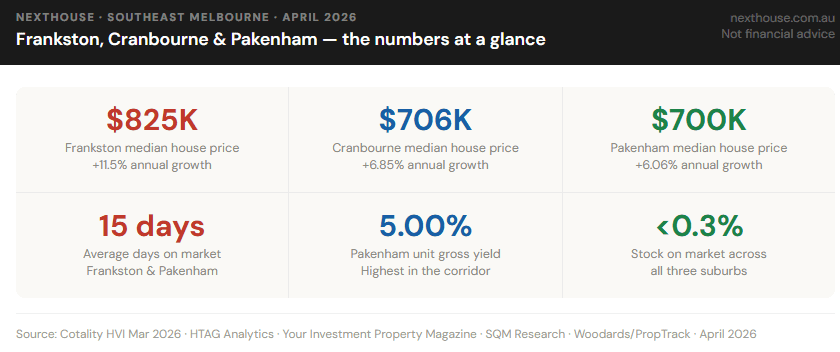
Three things jump out immediately. First, stock is critically low across all three suburbs — under 0.3% of total dwellings across the board. That’s less than one month of inventory everywhere you look. Second, houses are selling in just 15–18 days on average, which is extremely fast for outer-suburban Melbourne.
Frankston — The One That Surprised Everyone
So what’s actually driving that? A big part of it is the $3 billion+ Level Crossing Removal Program on the Frankston Line. And buyers notice. They price that kind of thing in, often before the work is even finished.
Then there’s something that doesn’t get talked about enough: the Metropolitan Activity Centre rezoning that was approved in 2025. Central Frankston has now been rezoned to allow buildings between 3 and 16 storeys, with Council fast-tracking a development pathway that launched in February 2026. This is a genuine structural shift — not a tweak, not a trial — in what Frankston is actually permitted to become.
If that sounds familiar, it should. Investors who were paying attention when Box Hill, Ringwood, and Footscray went through the same kind of rezoning process know exactly how this story tends to play out. Densification follows. Amenity improves. Demand compounds. Frankston is at the beginning of that same arc — and the rezoning makes it official.
Frankston LGA — Suburb by Suburb, April 2026
| Suburb | Median price | Annual growth | What’s happening |
| Frankston (core) | $825,000 | +11.5% | Hospital, beach, activity centre rezoning |
| Frankston North | $682,500 | +14.9% | Fastest growth in LGA — value catch-up underway |
| Frankston South | $1,200,000 | +8.2% | Prestige coastal — 84.5% clearance rate |
| Carrum Downs | $790,000 | +7.4% | Tightest vacancy in LGA (0.7%) — 7-day average sale |
| Langwarrin | $895,000 | +6.8% | Family suburb — peninsula lifestyle demand |
| Seaford | $855,000 | +7.1% | Beachside — strong first home buyer and investor demand |
Source: HTAG Analytics · Your Investment Property Magazine · Woodards suburb reports · PropTrack
Frankston North deserves a mention here. At $682,500 with 14.9% annual growth — the fastest of any suburb in the LGA — it’s doing what affordable pockets often do when a surrounding area transforms: catching up. Buyers who couldn’t afford Frankston proper are pushing into Frankston North, and prices are responding.
Rental yields in Frankston run at 3.71% for houses and 4.51% for units, with vacancy sitting at approximately 1.2%. That vacancy figure is the tightest of the three suburbs in this report — meaning the downside risk for rental income continuity is lowest here.
Cranbourne — The Metro Tunnel Winner
Cranbourne hasn’t had Frankston’s dramatic headline growth, but it’s had something arguably more significant for long-term value: the Metro Tunnel. Every study of rail upgrades in Melbourne shows that direct connectivity adds value. This one just went live. At a median house price of $706,250 and annual growth of 6.85%, Cranbourne is approximately $120,000 cheaper than Frankston and growing solidly. Properties are selling in 18 days. Clearance rates are running at 75%. Sales volumes are up 20.8% year-on-year.
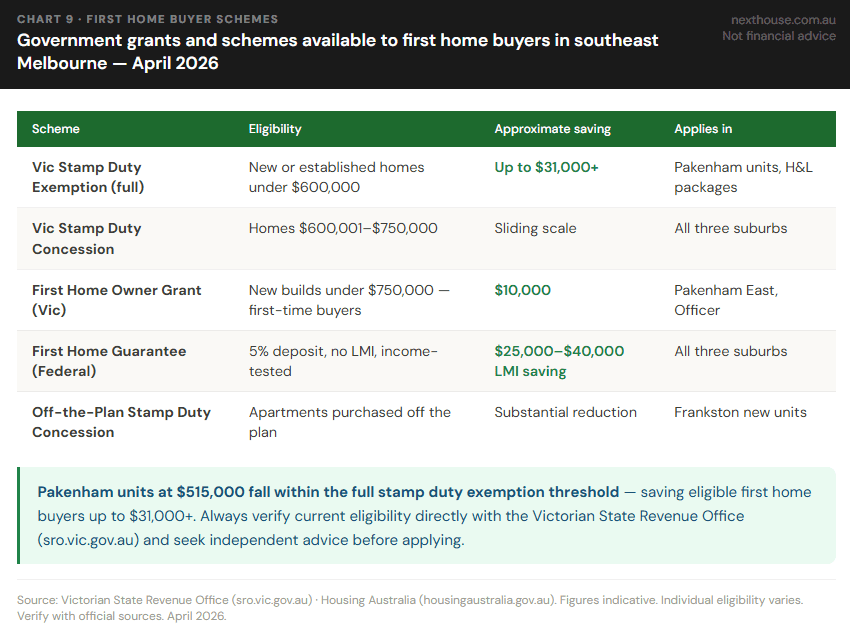
There’s also a stamp duty angle here that’s worth understanding. The suburb falls within Victoria’s $600,001–$750,000 stamp duty concession band for standard buyers. And importantly, Cranbourne units at $513,000 sit below the $600,000 full exemption threshold for eligible first home buyers — meaning they can purchase with zero stamp duty. That’s a saving of up to $31,000+ on top of an already accessible price point.
Cranbourne and Casey Area — Suburb by Suburb, April 2026
| Suburb | Median price | Annual growth | What’s happening |
| Cranbourne | $706,250 | +6.85% | Metro Tunnel connected |
| Cranbourne North | $760,000 | +6.5% | Lowest vacancy (~1.4%) |
| Cranbourne East | $740,000 | +3.5% | Population +52.4% |
| Cranbourne West | $720,000 | +5.8% | Established family suburb |
| Clyde North | ~$680,000 | +2.1% | 288% population growth |
| Clyde | ~$750,000 | +3.8% | lifestyle-focused buyers |
Source: HTAG Analytics · Your Investment Property Magazine · OpenAgent · .id Population Forecast (City of Casey)
These aren’t small numbers — they represent sustained structural demand for housing in this corridor for decades. Rental yields for Cranbourne are 4.09% for houses and 4.88% for units, with weekly rents of $540 and $482 respectively. Vacancy ranges from around 1.4% in established Cranbourne North to around 3.8% in fast-developing Cranbourne East where new supply is being absorbed into the market.
Pakenham — The Deepest Value, The Biggest Pipeline
Pakenham is the most affordable of the three and arguably the most interesting from an infrastructure perspective. At a house median of $700,000 and unit median of $515,000, it’s the entry-level choice in this corridor. But the infrastructure story is significant.
Pakenham’s unit yield of 5.00% gross is the strongest in the corridor — $500 per week on a $515,000 median unit. For cashflow-focused investors, that’s the headline number. House yields at 4.08% are essentially identical to Cranbourne. Vacancy sits at approximately 1.9%.
Pakenham and Cardinia Area — Suburb by Suburb, April 2026
| Suburb | Median price | Annual growth | What’s happening |
| Pakenham (core) | $700,000 | +6.06% | New elevated station — 15-day average sale |
| Officer | $760,000 | +4.83% | Established — strong family demand |
| Bunyip | $775,000 | +9.93% | Surprise performer — very limited stock (29 sales/year) |
| Tynong | $710,000 | +5.2% | Semi-rural — Pakenham line access |
| Pakenham East | Under development | — | 7,100 homes approved — 630 ha PSP |
| Officer South | Under development | — | New estates — H&L packages from $600K |
Source: HTAG Analytics · Your Investment Property Magazine · Cardinia Shire Council · OpenLot southeast corridor data
Bunyip at $775,000 with 9.93% annual growth is worth flagging. With only 29 sales per year, any increase in demand shows up dramatically in the median — but it’s also a genuine reflection of a suburb with very limited supply and lifestyle appeal. New house-and-land packages in Pakenham East under $750,000 also qualify for the $10,000 First Home Owner Grant.
The Real Cost of Commuting — Train vs Car in 2026
This is the conversation most property guides skip, but it matters enormously in outer-suburban Melbourne right now.
The conflict in the Middle East that closed the Strait of Hormuz in early 2026 has pushed Melbourne petrol to an average of $2.33 per litre. For southeast commuters who drive to work, that’s a material budget hit every single week of the year.
Annual Commute Cost — Driving vs Train, April 2026
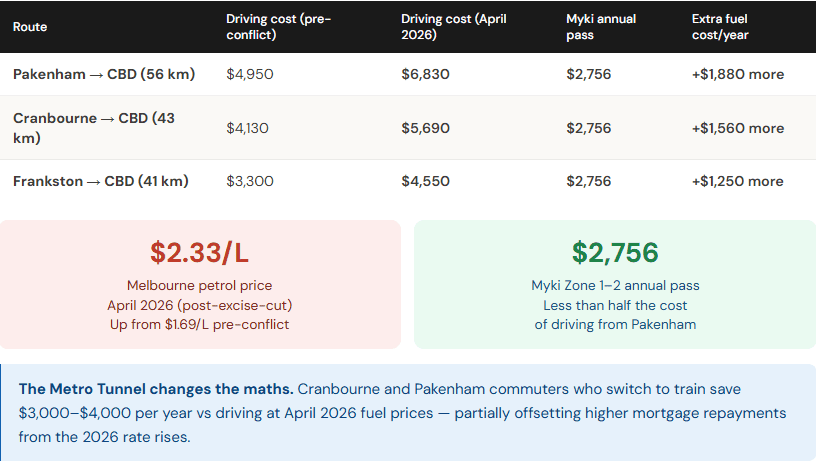
Assumptions: 9.4L/100km fuel economy · $2.33/L average petrol post-excise-cut · $1.69/L pre-conflict baseline · 230 working days/year · Myki Zone 1–2 annual pass $2,756 (PTV 2026). Source: AIP · Petrolmate · PTV · NextHouse calculations
The numbers here are striking. A Myki annual pass at $2,756 costs less than half what it costs to drive from Pakenham to the CBD at current petrol prices. The Metro Tunnel means Cranbourne and Pakenham commuters save $3,000–$4,000 per year by taking the train compared to driving — which meaningfully offsets some of the higher mortgage repayments from rate rises.
This is one of the reasons the Metro Tunnel’s February 2026 launch matters for property values. It doesn’t just make commuting faster — at current fuel prices, it makes commuting dramatically cheaper.
The Infrastructure That’s Already Built and What’s Still Coming
Southeast Melbourne Infrastructure Pipeline — April 2026
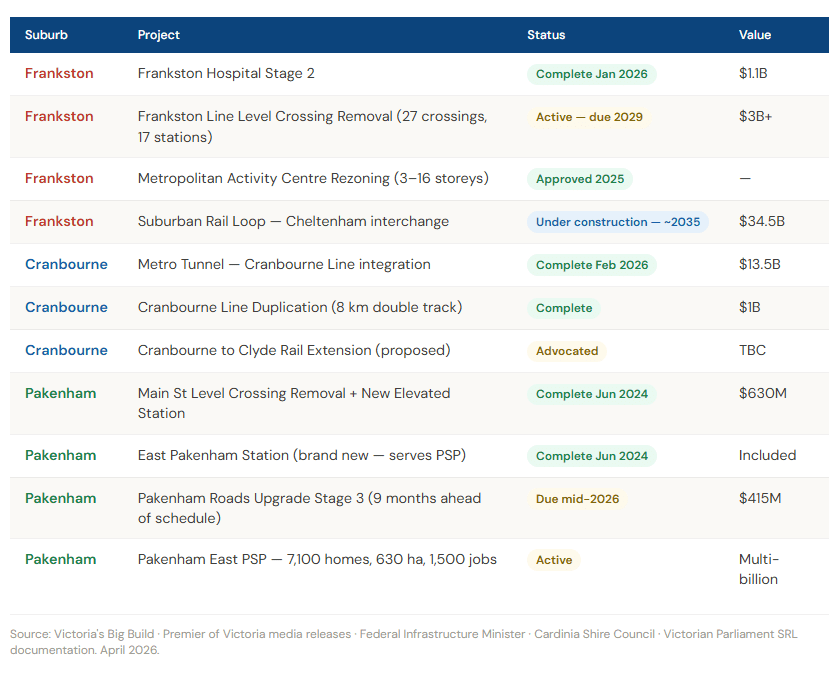
Source: Victoria’s Big Build · Premier of Victoria · Federal Infrastructure Minister · Cardinia Shire Council
First Home Buyer Schemes — What’s Available Here
Government Grants and Schemes — Victoria, April 2026
The Headwinds — Because They’re Real and Worth Knowing
The southeast corridor has genuine tailwinds. But there are also genuine headwinds that honest property coverage needs to address.
The RBA has raised rates twice in 2026, bringing the cash rate to 4.10% as at March. Multiple major banks are forecasting further hikes, with some scenarios putting the rate at 4.60–4.85% by end of year. Every 1% increase in the cash rate reduces typical borrowing capacity by approximately $100,000. That matters for buyers in this corridor who are often stretching to enter the market.
Construction costs are escalating at 4.0% annually in Melbourne in 2026 and there were 1,894 construction insolvencies nationally in the financial year to February 2026 — the highest of any sector in Australia. If you’re buying new in a greenfield area, build delays and cost overruns need to be in your planning. They’re not theoretical risks right now.
Fuel at $2.33 per litre is a real and ongoing budget pressure for outer-suburban households — especially for those who still drive to work. The train option partially addresses this for commuters, but not everyone in the southeast can use the Cranbourne and Pakenham lines to access their workplace.
These headwinds don’t change the fundamental supply-demand picture — stock under 0.3% of total dwellings, 15-day average sale times, vacancy well below the balanced market threshold. But they do affect how much buyers can borrow and how comfortable that borrowing feels month to month.
Which Suburb Suits Which Buyer?
Look, the data tells a pretty clear story depending on what you’re actually trying to do — so let’s break it down honestly rather than just throwing numbers at you.
If you want the strongest price growth and the tightest market, Frankston is the one to watch. It’s running at 11.5% annual growth with a 1.2% vacancy rate, which is genuinely tight. Yes, the entry price is the highest of the three at $825,000 — and that does put it above the full stamp duty exemption threshold — but the structural case here is hard to ignore. Hospital upgrades, rezoning activity, level crossing removals, the Suburban Rail Loop… of the three corridors, Frankston has the most going on underneath the surface.
If affordability and connectivity matter equally to you, Cranbourne hits a really interesting sweet spot. At $706,250, it’s more accessible than Frankston, and from February 2026 it gets direct Metro Tunnel access — that’s a genuine commute upgrade, not just a promise. Clearance rates are sitting at 75%, and units are still coming in under the full stamp duty exemption at $513,000. The City of Casey’s population growth is also one of the strongest in the country, which tends to do good things for demand over time.
Conclusion
Southeast Melbourne in April 2026 is a corridor that’s genuinely pulling in two directions at once. On one hand, the fundamentals are strong — stock is critically low, train connectivity has actually improved (not just been promised), infrastructure spending is substantial and largely committed, and population growth is strong and long-dated.
On the other hand, borrowing is harder than it was 12 months ago, building costs keep creeping up, and fuel prices are squeezing household budgets in a way that hits outer-suburban buyers harder than most. That’s just the reality of where we are.
The suburbs that tend to hold up best through conditions like these are the ones with the strongest infrastructure backing, the tightest stock levels, and the most durable demand — which is exactly why NextHouse focus on these three report. Knowing both sides of the story isn’t pessimism. It’s just how you end up making a call you’re still comfortable with five years from now.
Disclaimer: This report is general market commentary for educational and informational purposes only. It does not constitute financial, credit, real estate, or tax advice. NextHouse.com.au holds no AFSL, ACL, or real estate licence. Always seek advice from a licensed professional appropriate to your circumstances.