Something shifted in February 2026 — and most Australians felt it in their wallet before they could explain why. Then a separate story about inflation. Then a breaking news alert about the RBA. And they all feel like different problems landing at the same time — when really, they’re all chapters of the exact same story. In this article we have explained why Australian mortgage repayments are rising in 2026.
And explainable means you can actually do something about it. There isn’t a random pile of bad news happening at once. There’s one single chain of events — starting with a conflict in the Middle East, running through global oil markets, hitting Australian inflation, landing on the RBA’s desk, and ending up as extra dollars leaving your account every single month.
What Does a Middle East Conflict Have to Do with the Australian Mortgage Repayments Rising?
In early February, oil was at around USD $80 per barrel and within three weeks, it had surged past USD $98 — a jump of more than 50% in less than a month. That’s not just a number on a trading screen somewhere. That’s the thing that makes your petrol more expensive.
Your groceries are more expensive. Your trades are more expensive. And eventually — through a chain of events we’re about to walk through — your Australian mortgage repayments is more expensive too.
The Iran War → Your Mortgage: How the Chain Works
| Step | What Happened | Why You Should Care |
| 1. War breaks out | US and Israel strike Iran | Strait of Hormuz disrupted — global oil flow threatened |
| 2. Oil surges 50%+ | From ~$80 to $98+ per barrel | Biggest energy shock since COVID |
| 3. Aussie petrol jumps 35% | Australia imports most refined fuel | Hits your wallet at every servo |
| 4. Inflation spikes | CPI already at 3.8%, heading toward 5% | Well above RBA’s 2–3% comfort zone |
| 5. RBA hikes rates | Back-to-back hikes in Feb and Mar 2026 | Cash rate back to 4.10% |
| 6. Your repayments go up | ~$300/month extra for average household | Real money. Every month. |
Source: AMP Economics | RBA | Commonwealth Bank Economics | Reuters | Bloomberg
Why Does Australia Feel This More Than You’d Think?
Here’s the difference that matters: the United States produces most of its own oil. When global prices spike, American households have a domestic buffer. Australia doesn’t have that. We import the vast majority of our refined petroleum — which means when the global oil price jumps 50%, Australian petrol prices follow almost immediately, with basically nothing to soften the blow.
Commonwealth Bank economist Harry Ottley put it plainly in mid-March 2026: the RBA would have to keep raising rates because inflation was already too high — and the Australian economy was actually going well, which counterintuitively makes the problem harder to fix. A strong economy with rising energy prices is a tough combination for any central bank to manage.
Why Is Australian mortgage repayments Still So Expensive?
Before any of this started, Australia’s inflation story was already a long and exhausting one. But slowly, painfully slowly, things started coming down. By 2025, inflation had dropped to 3.2% and the RBA had started cutting rates — three times across the year.
Mortgage holders were getting a little breathing room. Household budgets were stabilising. The conversation was shifting from “how bad will it get” to “how quickly will it recover.”
Then the oil shock arrived and changed the entire calculation.
Australia’s Inflation Journey
| Period | Headline CPI | What Was Happening |
| Late 2022 | 7%+ | Peak inflation — post-COVID surge |
| Early 2025 | 3.2% | Gradual decline, RBA finally cutting |
| January 2026 | 3.8% | Above RBA’s 3% ceiling |
| Mid 2026 (forecast) | 4.8–5%+ | War impact still flowing through |
Source: ABS | Treasury | NAB forecast | RBA
Treasurer Jim Chalmers confirmed in mid-March that government modelling now shows inflation could peak in the “mid to high fours” — that’s potentially 4.8 to 4.9%. And every rate rise adds more to your monthly repayments. That’s the chain. That’s why a war in Iran shows up on your mortgage statement.
Why Did the RBA Raise Rates — Again?
All that breathing room households had slowly gained across the year, wiped out in back-to-back decisions. But the part that really doesn’t get talked about enough? It almost didn’t happen. Five board members voted yes. Four voted no. One single vote separated Australian mortgage holders from a different outcome. That’s not a confident, united central bank sending a clear message.
That’s nine very smart people in a room, deeply divided about the right call — and the narrowest possible majority winning out. And it tells you something genuinely important — even the people running Australia’s monetary policy are deeply uncertain about the right call right now. This isn’t a confident, decisive RBA. This is an institution split almost exactly down the middle.
RBA Rate Timeline: 2025 to Now
| Date | Decision | Cash Rate | What Drove It |
| Feb 2025 | Cut ↓ | 4.10% | Inflation finally declining |
| Jul 2025 | Hold | 3.85% | Caution on economic growth |
| Nov 2025 | Cut ↓ | 3.60% | More inflation progress |
| Feb 2026 | Hike ↑ | 3.85% | Inflation re-accelerating |
| Mar 2026 | Hike ↑ | 4.10% | Iran War + sticky inflation — 5 to 4 vote |
Source: RBA
RBA Governor Michele Bullock didn’t mince words. Her message was simple: the war didn’t create Australia’s inflation problem. It just made an existing one significantly worse. The fire was already burning — the oil shock just threw petrol on it. And the global financial world noticed. But strip away the financial jargon and the media commentary, and what you’re left with is actually quite unsettling.
What the Rest of 2026 might Look Like
| Scenario | What Needs to Happen | Where Rates Land |
| Best case | War ends, oil retreats, inflation peaks at 4.2% | RBA holds at 4.10% |
| Base case | War drags on, inflation peaks at 4.8–5% | One more hike → 4.35% |
| Worst case | War escalates, oil hits $150, inflation breaks 5.5% | Two more hikes → 4.60% |
Source: AMP Economics | Commonwealth Bank | RBA
How Much Is This Actually Costing Me Each Month?
Here’s where global economics stops being abstract and starts being very, very personal.
AMP Economics has done the maths on exactly what the combination of higher petrol prices and two rate hikes is costing the average Australian household every single month right now.
Monthly Household Cost Increase — The Real Numbers
| What’s Costing More | Monthly Hit | Annual Hit | How It’s Calculated |
| Extra fuel costs | +$86/month | +$1,032/year | 35% petrol price rise from Feb average |
| Feb 2026 rate hike | +$110/month | +$1,320/year | Based on $660K average mortgage |
| Mar 2026 rate hike | +$110/month | +$1,320/year | Based on $660K average mortgage |
| Total extra cost | ~$300/month | ~$3,600/year | Combined impact |
Source: AMP Economics, March 2026
Three hundred dollars a month. Every single month. That’s $3,600 a year quietly disappearing — money that would otherwise go toward savings, school fees, a family holiday, or building toward your next property.
And it’s not just the financial hit that matters. An ANZ survey taken on the same day as the March rate decision found consumer confidence had fallen to its lowest point since the COVID lockdowns of 2020. When people feel squeezed, they put big decisions on hold. That includes property purchases — which is part of why Melbourne’s auction clearance rates have been softening.
What This Actually Means for Melbourne Property Market?
Here’s something the headlines rarely bother to explain — not every Australian city is feeling this the same way. Perth is booming. Brisbane is still running hot. And Melbourne? How Melbourne Stacks Up Against Other Capitals Right Now
| City | 12-Month Growth | Direction | What’s Driving It |
| Perth | Strong positive | Accelerating | Resources + defence sector |
| Brisbane | Strong positive | Steady | Migration + Olympic pipeline |
| Adelaide | Positive | Steady | Relative affordability |
| Sydney | Softening | Slowing | Affordability ceiling |
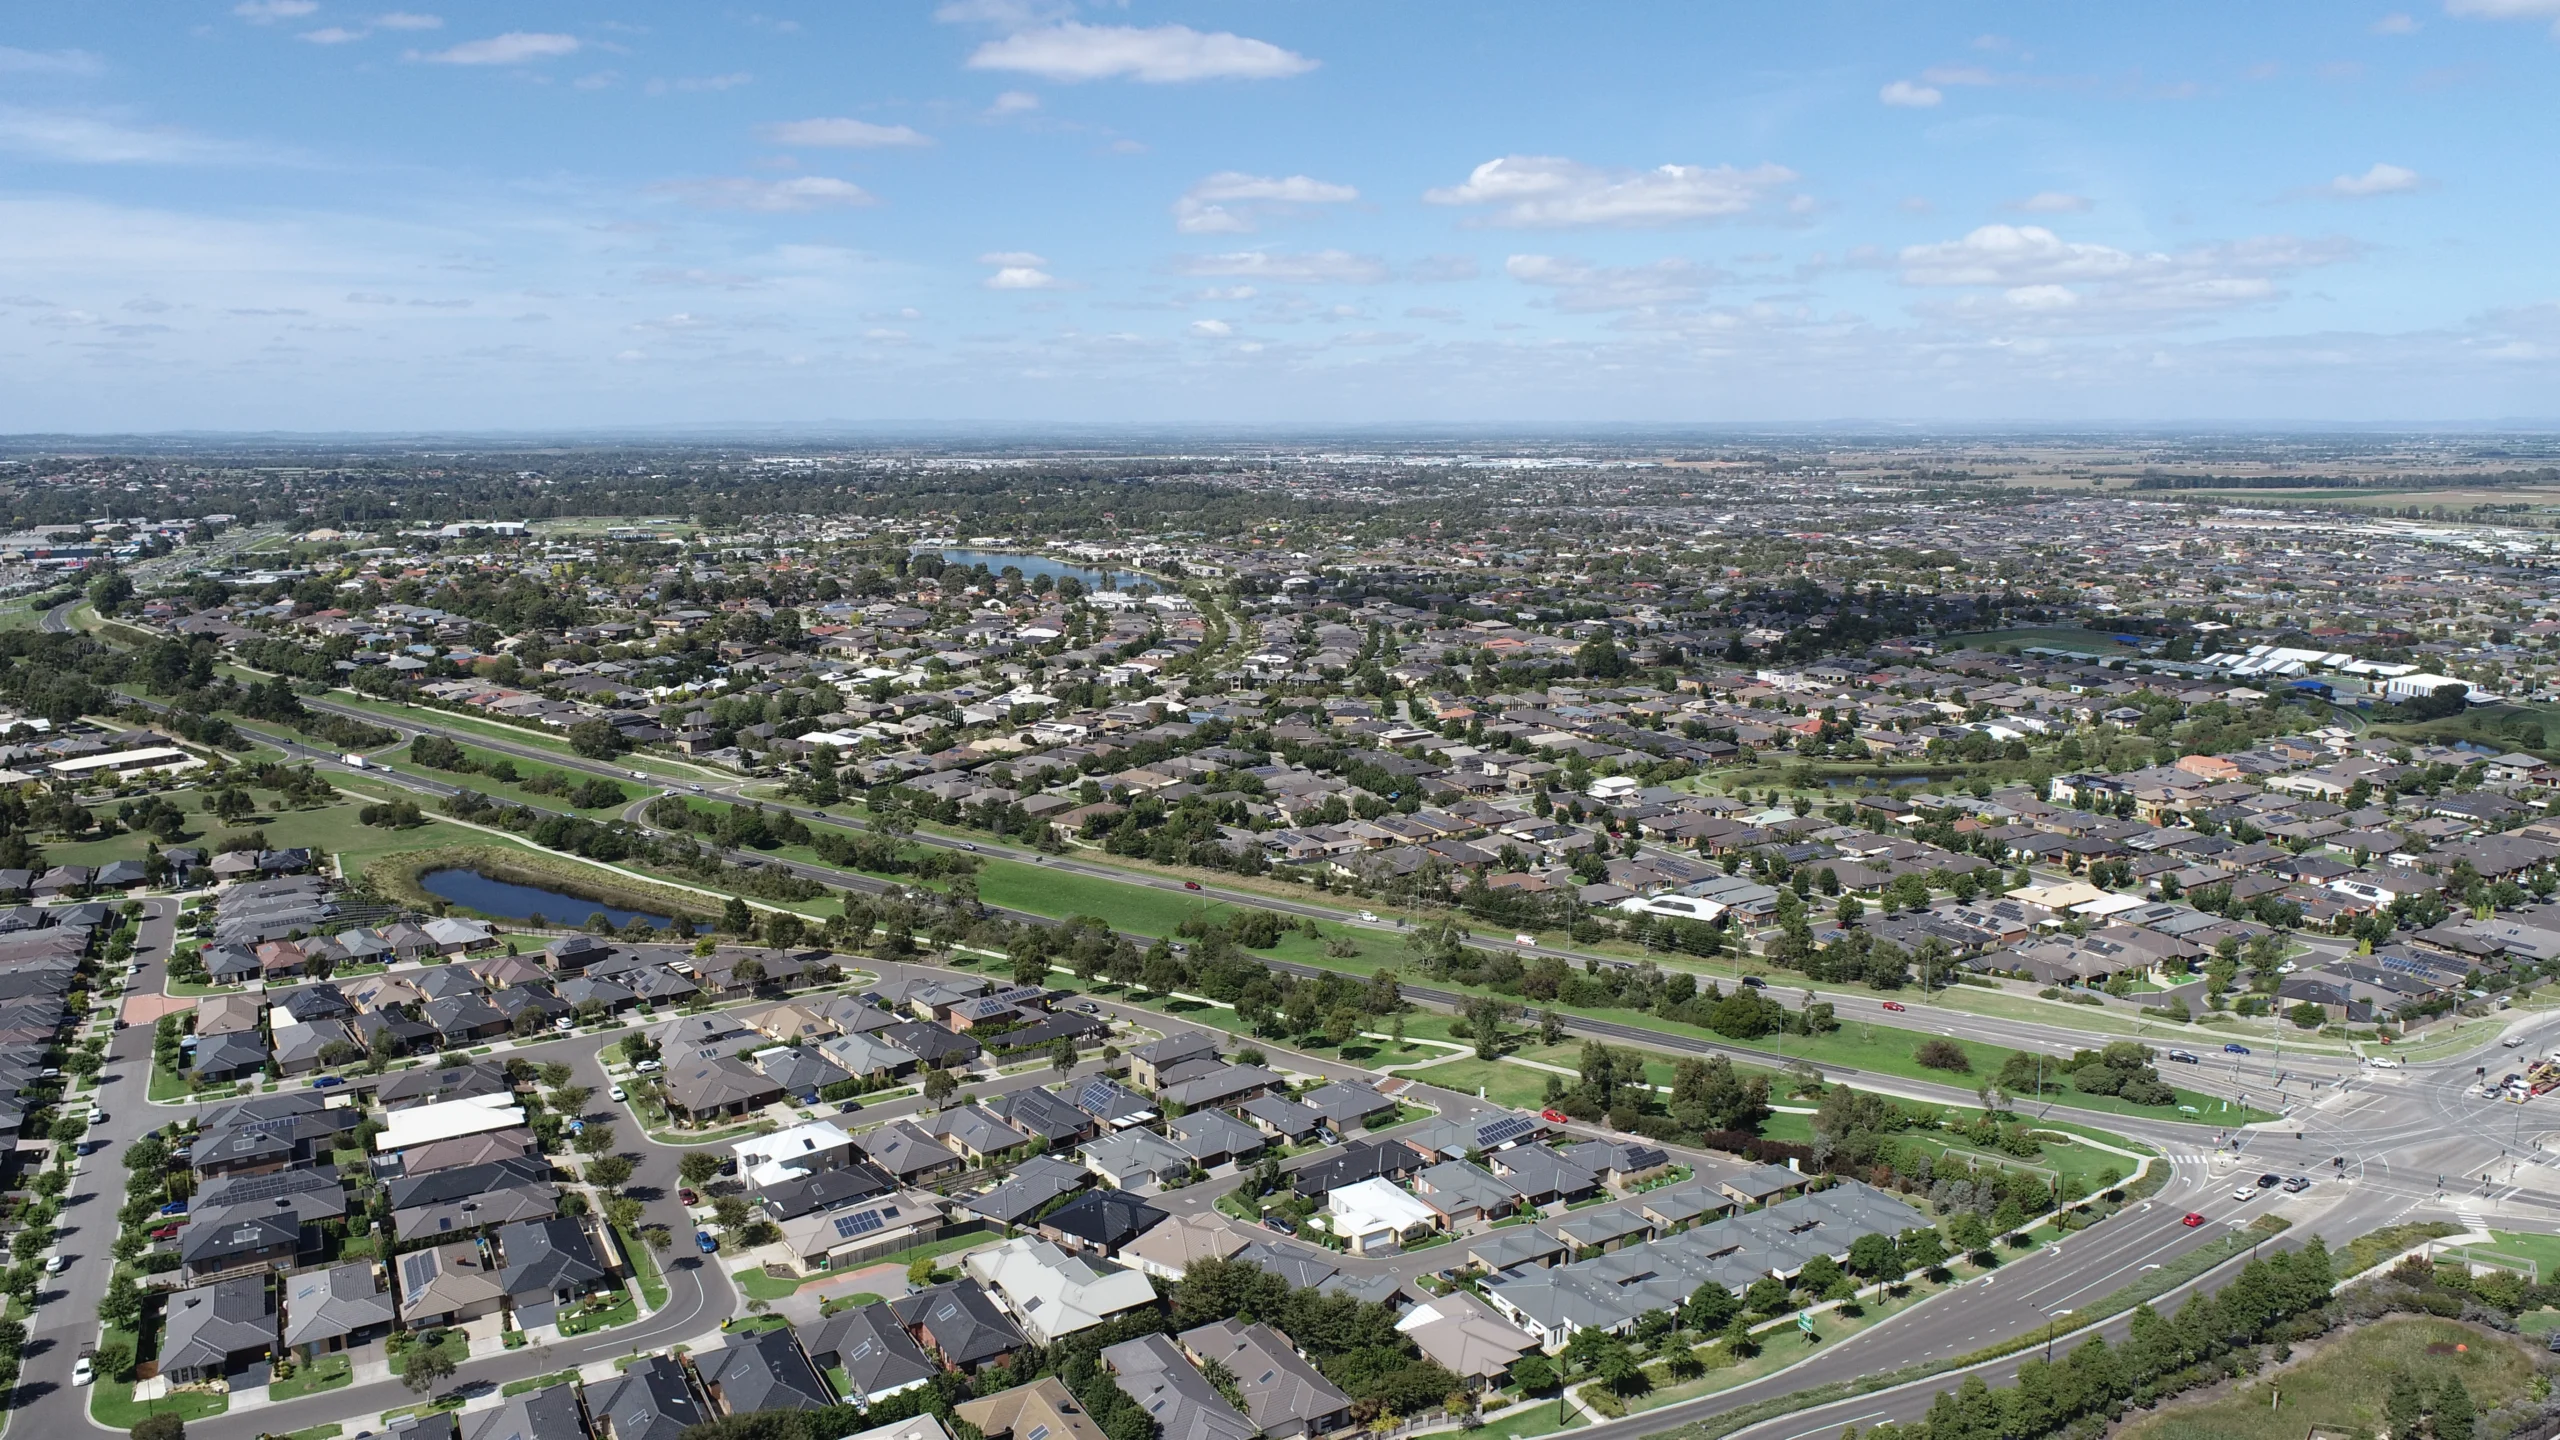
| Melbourne | ~2.1% | Flat to soft | Rate sensitivity + high invest |
Source: Cotality (CoreLogic) Monthly Housing Chart Pack, March 2026
Melbourne carries the highest concentration of investors with large mortgages of any Australian capital. That makes it more sensitive to rate movements than somewhere like Perth, where a booming resources sector provides a completely separate growth engine underneath the Melbourne property market.
Melbourne at a Glance — March 2026
| Metric | Melbourne | National Average |
| Monthly value change | ~0.0% | +0.6% |
| Annual value growth | ~2.1% | +9.6% |
| Auction clearance rate | ~61% | 66.6% |
| Rental vacancy rate | 1.5% | 1.5% |
| Annual rental growth | +5.5% | +5.5% |
| Inner unit: buy vs rent gap | cheaper to rent | — |
Source: Cotality (CoreLogic) March 2026 | REIV
Here’s the part worth sitting with: while Melbourne’s capital growth has gone quiet, the rental market is telling a completely different story. Vacancy rates are near record lows at 1.5%. Rents are climbing at 5.5% annually.
Why Aren’t Enough Homes Being Built?
The oil shock has made it worse and the construction costs are climbing again. Tradies are still hard to find. Materials are getting more expensive by the month. Developers are looking at the numbers and quietly walking away from projects.
Australia’s total residential property market is worth over $12.5 trillion, with just $2.5 trillion in outstanding mortgage debt — a loan-to-value ratio of around 20% across the whole market. That’s an enormous equity buffer sitting behind the headlines.
This is not a market with crumbling foundations. This is a market going through a rate cycle.
Why Is the Government Fighting the RBA?
After the March decision, something unusual happened — a rare and public disagreement between the Treasurer and the Reserve Bank. It’s actually a coherent argument. The RBA, however, was unmoved. Governor Bullock’s position: inflation was already too high before the first shot was fired in Iran. Letting supply-side shocks embed into long-term inflation expectations — as happened in 2021–2022 — would be a far more serious and lasting problem.
Both sides have valid points. For property investors, the practical takeaway is this: watch the May budget closely. Changes to Capital Gains Tax and negative gearing are widely expected, and they could add another layer of complexity to investment decisions at exactly the wrong time.
So What Should You Actually Do About Rising Australian Mortgage Repayments?
If you’re a first home buyer, this environment is more interesting than it looks. Melbourne values are flat to modestly falling — you’re not chasing a rapidly rising market. Entry-level properties have actually outperformed nationally, rising 11.5% versus 6.6% for upper-quartile homes. The most accessible price points are attracting the most competition.
The key risk is your borrowing capacity. With rates at 4.10% and potentially heading higher, bank serviceability tests are tighter than they were six months ago. Getting your finances sorted before any further hike matters — each 0.25% rise quietly reduces what you can borrow. The Victorian government’s first home buyer schemes — including the 5% Deposit Scheme with no income caps and Help to Buy with just a 2% deposit — are sitting there right now and won’t wait for perfect conditions.
If you already own one or two investment properties, three things matter most. Review your loan structure now — if you’re on variable, run the numbers on what another 0.25 – 0.50% does to your monthly cash flow before it arrives. Focus on your rental income, not just your capital growth line — the income side of Melbourne investment is genuinely strengthening. And don’t panic-sell into a soft market. The supply shortage underneath Melbourne is structural. A short-term softening in values is completely different from a crash. Selling now locks in any paper loss permanently.
Conclusion
A war in the Middle East. A 50% oil price spike. Back-to-back rate hikes. Three hundred dollars a month quietly leaving household budgets. It genuinely is a lot. But here’s what the data shows sitting underneath all of it: Australia’s housing market has a structural supply shortage that isn’t going away, rental rates near record lows, rents reaccelerating, and $12.5 trillion in property equity with only $2.5 trillion in debt sitting against it.
Understanding the difference between a temporary rate cycle and a structural market breakdown is what separates the investors who come out ahead from the ones who make permanent decisions based on the loudest headline of the week.
Want to track which Melbourne suburbs are holding strong through the rate cycle? NextHouse suburb intelligence monitors data growth, rental yields, and infrastructure commitments across Greater Melbourne.
FAQs
- How much more could my Australian Mortgage Repayments go up?
One more hike to 4.35% adds roughly another $110 per month on a $660,000 mortgage — on top of the $220 already added since February. Two more hikes to 4.60% means $330 extra per month from where you started. That’s the range you’re planning around. - Is Melbourne property actually going to fall?
Flat and falling are very different things. Melbourne is flat — growing at 2.1% while the national average sits at 9.6%. That’s underperformance, not collapse. The rental market is near record tightness. And Melbourne has recovered from every single rate-driven softening in its history. The supply shortage hasn’t gone anywhere. - Is now a bad time to buy in Melbourne?
Depends on your finances — not the headlines. If your serviceability is solid, history is clear: time in the market consistently beats waiting for perfect conditions. What’s also clear is that every time Melbourne buyers waited for certainty, they paid more when they eventually moved. The market doesn’t wait for confidence. - What is the government actually doing to help?
More than most people realise. Victorian first home buyers currently have access to a $10,000 First Home Owner Grant, full stamp duty exemption up to $600,000, a 5% Deposit Scheme with no income caps. These schemes exist right now — but they have caps and they have end dates. - Will the RBA cut rates again anytime soon?
Not in 2026 — unless the Iran conflict ends quickly and oil retreats sharply. The base case is one more hike before any pause. The four members who voted against the March hike want to hike eventually too — just not yet. Nobody at the RBA is talking about cuts. Plan accordingly. - Does the oil shock affect my rental income?
Yes — and in your favour. Higher living costs plus Melbourne’s 1.5% vacancy rate are pushing rents upward. Annual rental growth is running at 5.5% nationally. If you own a well-located property, your income side is quietly strengthening right now — even while capital growth takes a breather.
Disclaimer: This report is for educational and informational purposes only. It does not constitute financial, investment, or legal advice. Always seek professional advice before making property decisions.