Honestly? For the past three years, Melbourne property has been the friend who shows up to every party and leaves early. Brisbane was booming. Perth was on fire. Adelaide was quietly having its moment. And Melbourne was just… there. Here are some of the Melbourne Suburbs Smart Buyers Are Quietly Moving.
Prices went nowhere. Investors moved on. Buyers kept waiting. Here’s the thing about the right moment in property — it never sends you a message. You only ever see it clearly once it’s gone, watching the prices you could have paid six months ago disappear in the rear-view mirror. That moment is here for Melbourne suburbs. Right now.
And when a city finally catches up after years of underperformance, the growth doesn’t spread evenly across every street and Melbourne suburb. It concentrates — piling into specific places where infrastructure, tight rentals, and below-median prices collide at the same time. Those places move first. And several of them are already moving.
Why Is Melbourne and Melbourne suburbs smart buyers Actually Moving This Time?
Last financial year, nearly 88,000 people moved to Victoria. In that same period, fewer than 12,000 new homes were built — the lowest number in 11 years. The annual shortfall between people arriving and homes being built is running at roughly 20,000 dwellings. And with construction costs only growing at 2.7% a year, the building industry isn’t going to magically accelerate its way out of this problem anytime soon.
More people keep coming. Fewer homes keep getting built. That gap doesn’t fix itself — it just keeps pushing rents higher, yields better, and eventually, prices up. The maths is not complicated. It’s just uncomfortable if you’ve been sitting on the fence.
Melbourne Macro Snapshot — March 2026
| Metric | Figure | Source |
| Melbourne median house | ~$947,000 | Cotality HVI, Jun 2025 |
| KPMG 2026 growth forecast | +6.6% capital city | KPMG, Jan 2026 |
| Domain year-end median | $1.17M | Domain, mid-2025 |
| Melbourne rental vacancy | 2.0% (10yr avg: 3.0%) | SQM Research, Dec 2025 |
| Dwellings completed | 11,888 an 11-year low | ABS Building Activity, 2024 |
| Annual housing shortfall | ~20,000 dwellings/year | Vic Housing Statement; ABS |
| Victoria overseas migration | 87,768 people (FY24–25) | ABS, Dec 2025 |
| Investor lending growth | +18.5% in Sep Q 2025 | ABS Lending Indicators |
| RBA cash rate | 3.85% (after Feb 2026 cut) | RBA, 3 Feb 2026 |
| Construction cost growth | Only +2.7% annually in Vic | Cotality Cordell CCCI, 2025 |
Which Melbourne Suburb Is Still Accessible — Right Now?
These are the Melbourne suburbs still sitting below Melbourne’s $947,000 median. The bigger the discount, the louder the clock is ticking.
| Suburb | Median House Price | Gap to Melbourne Median |
| Werribee | $630,000 | −33% |
| Epping | $730,000 | −23% |
| Dandenong | $735,000 | −22% |
| Frankston | $832,000 | −12% |
| Sunshine | $837,000 | −12% |
| Bundoora | $888,000 | −6% |
| Springvale | $930,500 | −2% |
| Melbourne Median | $947,000 | — |
| Cheltenham | $1,287,000 | +36% |
| Clayton | $1,300,000 | +37% |
12-Month Price Growth — Who’s Already Running Hot?
| Suburb | 12-Month Growth | vs Melbourne Average (~4.0%) |
| Frankston | +11.5% | Nearly 3× the average |
| Springvale | +9.5% | More than double |
| Clayton | +8.6% | Well above average |
| Epping | +5.8% | Above average |
| Cheltenham | +5.8% | Above average |
| Dandenong | +4.9% | Above average |
| Werribee | +3.5% (est.) | Building momentum |
| Sunshine | +3.1% houses / +18.85% units | Units — window possibly closed |
| Bundoora | +2.1% | Still early days |
The 8 Melbourne Suburbs Where the Clock Is Ticking Loudest
Epping — $730,000 · CRITICAL
Epping tops the list for one simple reason — three big things are happening here right now, not sometime in the future. The $813 million Northern Hospital expansion is physically under construction, due mid-2026. The $2 billion New Epping precinct by developer Riverlee is already on site. And Epping is one of only 10 Victorian suburbs where high-density planning laws are already live — 12 storeys, fast-track approvals, no VCAT delays.
Victoria’s busiest emergency department handles 110,000-plus patients a year. When the new Ambulatory Care Centre opens mid-2026, more professionals move to the area permanently. More professionals mean more renters. More renters mean higher yields. Higher yields mean more buyers. You know where prices go from there. At $730,000 — 23% below Melbourne’s median — with a 4.0% gross yield, Epping is the best value play on this list. A 10–15% move in 12 months isn’t a bold prediction..
Catalyst: $813M hospital under construction + GC252 Activity Centre enacted + $2B Riverlee precinct mobilising
| House Median | Unit Median | 12mo Growth | House Yield | Vacancy |
| $730,000 | $510,000 | +5.8% | 4.0% | ~1.5–2.0% |
Springvale — $930,500 · CRITICAL
Springvale is growing at +9.5% a year and somehow still sits just $17,000 below Melbourne’s city-wide median. That’s not a minor transport upgrade. That’s a suburb that just got a completely new relationship with the city centre.
Catalyst: Metro Tunnel live + GC252 enacted (12 storeys core) + development super-site assembled
| House Median | Unit Median | 12mo Growth | House Yield | Vacancy |
| $930,500 | $650,000 | +9.5% | 3.4% | ~1.2% |
Dandenong — $735,000 · CRITICAL
The vacancy rate sits at approximately 0.7%, which is one-third of Melbourne’s city average, in a suburb sitting right beside an employment cluster of over 66,300 workers. Unit yields are running at 5.4% gross. Those are not the numbers of a suburb in trouble. Those are the numbers of a suburb where demand is running miles ahead of supply. The $2 billion Capital Alliance masterplan directly opposite Dandenong Station got Planning Minister approval in October 2024. Stage 1 construction starts in 2026. The Metro Tunnel is live.
Catalyst: $2B masterplan approved Oct 2024 + Stage 1 construction 2026 + 66,300-worker NEIC + Metro Tunnel live
| House Median | Unit Median | 12mo Growth | Unit Yield | Vacancy |
| $735,000 | $475,000 | +4.9% | 5.4% | 0.7% |
Sunshine — $837,000 · CRITICAL
Three completely separate billion-dollar infrastructure projects are converging on one suburb at the same time. The Metro Tunnel is live. Units here have already surged 18.85% in 12 months. For units, the window may genuinely have already closed. Houses at $837,000 are the last real entry point into what will be Melbourne’s western transport mega-hub within a decade.
Catalyst: $4.1B Superhub underway + $12B Airport Rail confirmed + Metro Tunnel live + NEIC designation
| House Median | Unit Median | House Growth | Unit Growth | Vacancy |
| $837,000 | $568,000 | +3.1% | +18.85% | ~1.2% |
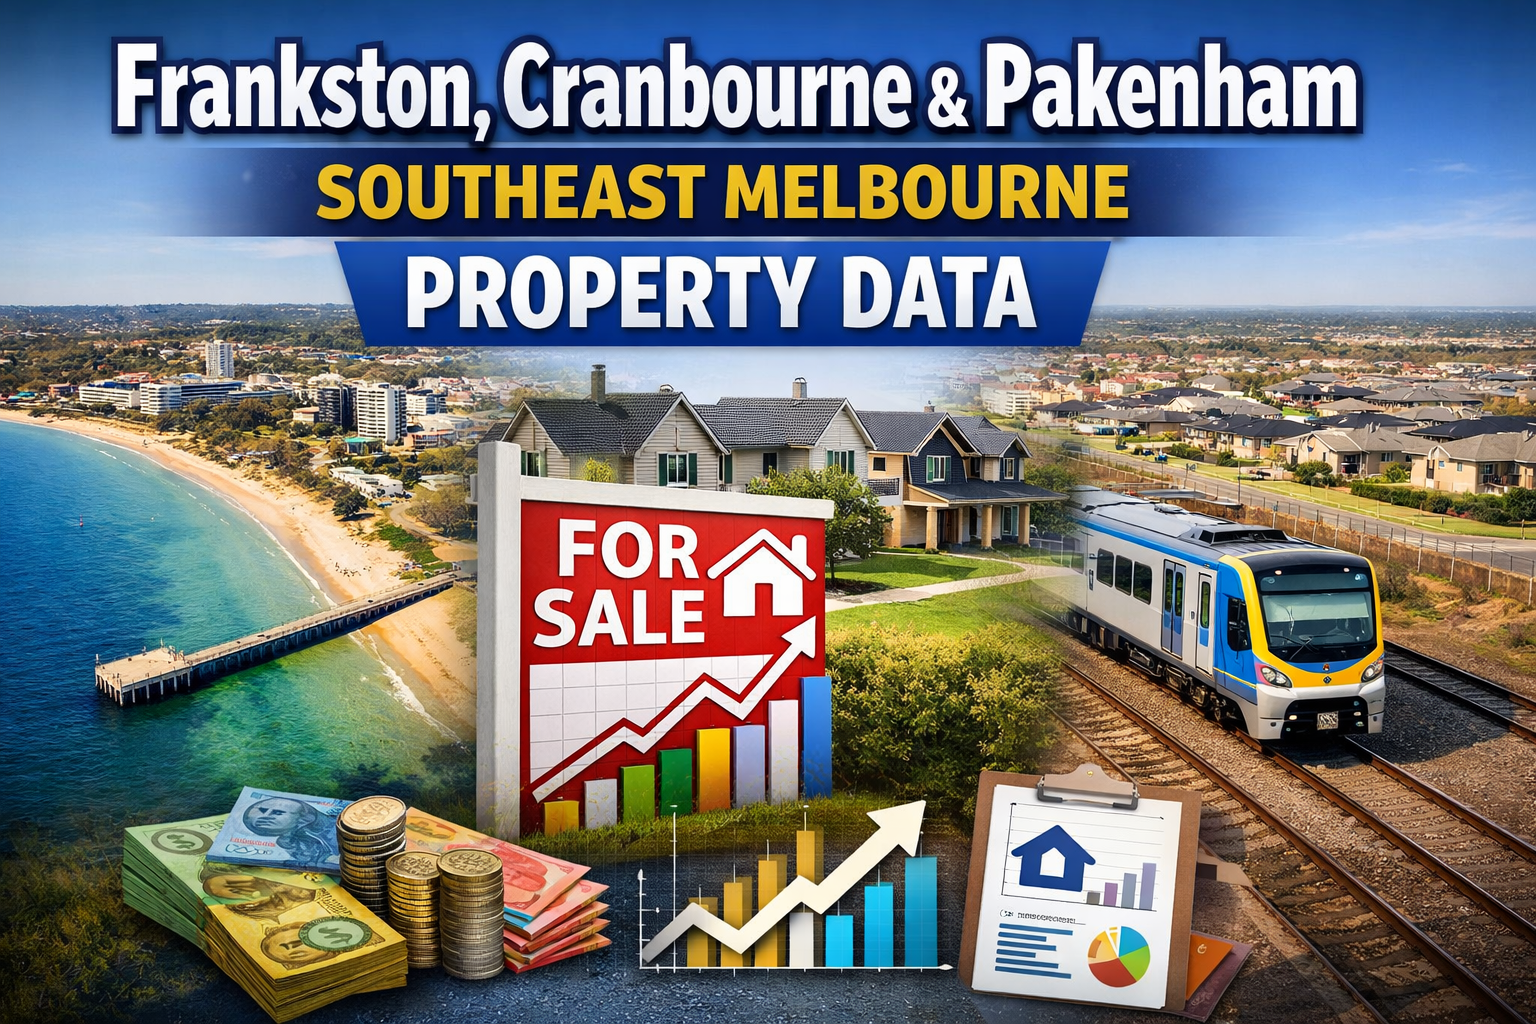
Frankston — $832,000 · HIGH
Frankston isn’t a hidden gem anymore — it’s an open secret the market is actively repricing. Growing at +11.5% annually, that’s nearly three times Melbourne’s average. And it’s still sitting 12% below the city median. The $562 million Peninsula University Hospital opened in 2025, permanently lifting the employment profile of the area. GC252 planning controls allow 16-storey development in the core precinct. At this growth rate, Frankston’s median hits approximately $927,000 within 12 months. At that point, it’s essentially at Melbourne’s current average. The window is not just closing — it’s closing fast, with a specific and calculable timeline attached to it.
Catalyst: GC252 enacted (16 storeys) + $562M Peninsula University Hospital open + direct CBD rail
| House Median | 12mo Growth | House Yield | Vacancy | CBD Distance |
| $832,000 | +11.5% | ~4.0% | ~1.1% | 42km |
Cheltenham — $1,287,000 · HIGH
Yes, Cheltenham is above Melbourne’s median. But look at its neighbours. Highett is $1.4M+. Mentone is $1.5M+. Beaumaris is $2M+. Not one of those suburbs has a confirmed SRL East station. Cheltenham does. The $30 to $34.5 billion Suburban Rail Loop East has all major contracts awarded, tunnel boring machines arriving at Clarinda in 2026, and a Draft Structure Plan on the table proposing 4,770 new dwellings around the station precinct. The vacancy rate is 0.83%. And if you look at every major rail infrastructure project in Melbourne’s history, the steepest price appreciation happens 2 to 5 years before a station opens — not after. That window opens now.
Catalyst: SRL East TBMs arriving 2026 + 4,770-dwelling structure plan + 0.83% vacancy
| House Median | Unit Median | 12mo Growth | Unit Yield | Vacancy |
| $1,287,000 | $689,000 | +5.8% | 4.5% | 0.83% |
Werribee — $630,000 · HIGH
Most affordable on the list. For a suburb that buyers have been quietly discounting for years specifically because of travel time, that is a fundamental rewrite of its value equation. Layer on top of that: 58,300 planned jobs in the East Werribee Employment Precinct, a $271 million law courts complex under active construction, a $236 million emergency department expansion at Werribee Mercy Hospital, and Wyndham LGA growing at about 4.2% per year.
A 33% discount to Melbourne’s median was always about commute time and perception. Both of those things just changed. The price will follow.
Catalyst: West Gate Tunnel open Dec 2025 (−20 min) + 58,300-job Employment Precinct + $271M Law Courts
| House Median | 12mo Growth | House Yield | Unit Yield | Vacancy |
| $630,000 | +3.5% | 3.76% | 4.78% | ~1.5% |
Bundoora — $888,000 · ELEVATED
This is not a planning concept gathering dust. It’s a signed agreement with a committed developer and shovels in the ground. At $888,000, 16km from the CBD, with a 36,000-student campus next door and a proposed SRL North station in the planning corridor, Bundoora is still priced like a quiet uni suburb. The market hasn’t updated its view yet. It will.
Catalyst: $5B La Trobe City masterplan signed + $82M Health Clinic under construction + SRL North proposed
| House Median | Unit Median | 12mo Growth | Unit Yield | Vacancy |
| $888,000 | $488,000 | +2.1% | 5.1% | ~1.8% |
The Affordability Tipping Point Index
Every Melbourne suburbs on this list gets scored out of 40 across four things that actually matter: how far below the median it sits, how strong the rental yield is, how confirmed and close the infrastructure is, and how much price momentum it’s already built over the past 12 months. Ten points each.
Hit 30 or above and you’re in serious territory. That’s where the combination of affordability, rental pressure, and confirmed infrastructure creates conditions where meaningful price movement within 12 months isn’t just possible — it’s probable.
| Suburb | Median | 12mo Growth | Score | Risk |
| Epping | $730K | +5.8% | 34/40 | CRITICAL |
| Springvale | $930.5K | +9.5% | 31/40 | CRITICAL |
| Dandenong | $735K | +4.9% | 31/40 | CRITICAL |
| Sunshine | $837K | +3.1% / +18.85% units | 30/40 | CRITICAL |
| Frankston | $832K | +11.5% | 29/40 | HIGH |
| Clayton | $1,300K | +8.6% | 28/40 | HIGH |
| Cheltenham | $1,287K | +5.8% | 24/40 | HIGH |
| Werribee | $630K | +3.5% | 24/40 | HIGH |
| Bundoora | $888K | +2.1% | 24/40 | ELEVATED |
The Single Number Worth Watching
If you only look at one number across all of these Melbourne suburbs, make it the rental vacancy rate. Everything else is noise by comparison.
It’s the market’s earliest warning signal — the thing that moves before prices do. When vacancy drops this low, the sequence doesn’t ask for permission. Rents go up. Yields improve. More buyers show up. Prices follow. It happens in that order, every single time, and it’s already running in every suburb on this list.
| Suburb | Vacancy Rate | What It Means |
| Dandenong | 0.7% | 3× below Melbourne average |
| Cheltenham | 0.83% | Extremely tight |
| Frankston | ~1.1% | Well below average |
| Springvale | ~1.2% | Below average |
| Sunshine | ~1.2% | Below average |
| Werribee | ~1.5% | Below average |
| Epping | ~1.5–2.0% | At or below average |
| Bundoora | ~1.8% | Below average |
Every Melbourne suburbs on this list sits below Melbourne’s city-wide average. That’s the market quietly telling you something important — before the prices have fully caught up with it.
3 Things to Do Before You Act
- Check Planning Controls: Epping, Springvale, Preston, and Frankston all have high-density controls already live under GC252 since April 2025. Live controls mean developers are already moving. That’s a completely different risk profile from a suburb still waiting for upzoning to happen.
- Vacancy Rate: Head to SQM Research and check the postcode. Below 1.5% means genuine rental undersupply — and that feeds directly into rent growth, better yields, more buyer competition, and higher prices. Every time, without exception.
- Prioritise Infrastructure: The West Gate Tunnel is open. The Metro Tunnel is running. The Northern Hospital is a building site with a completion date. These aren’t election promises. They’re facts on the ground repricing these suburbs right now, whether the broader market has noticed yet or not.
Final Thoughts
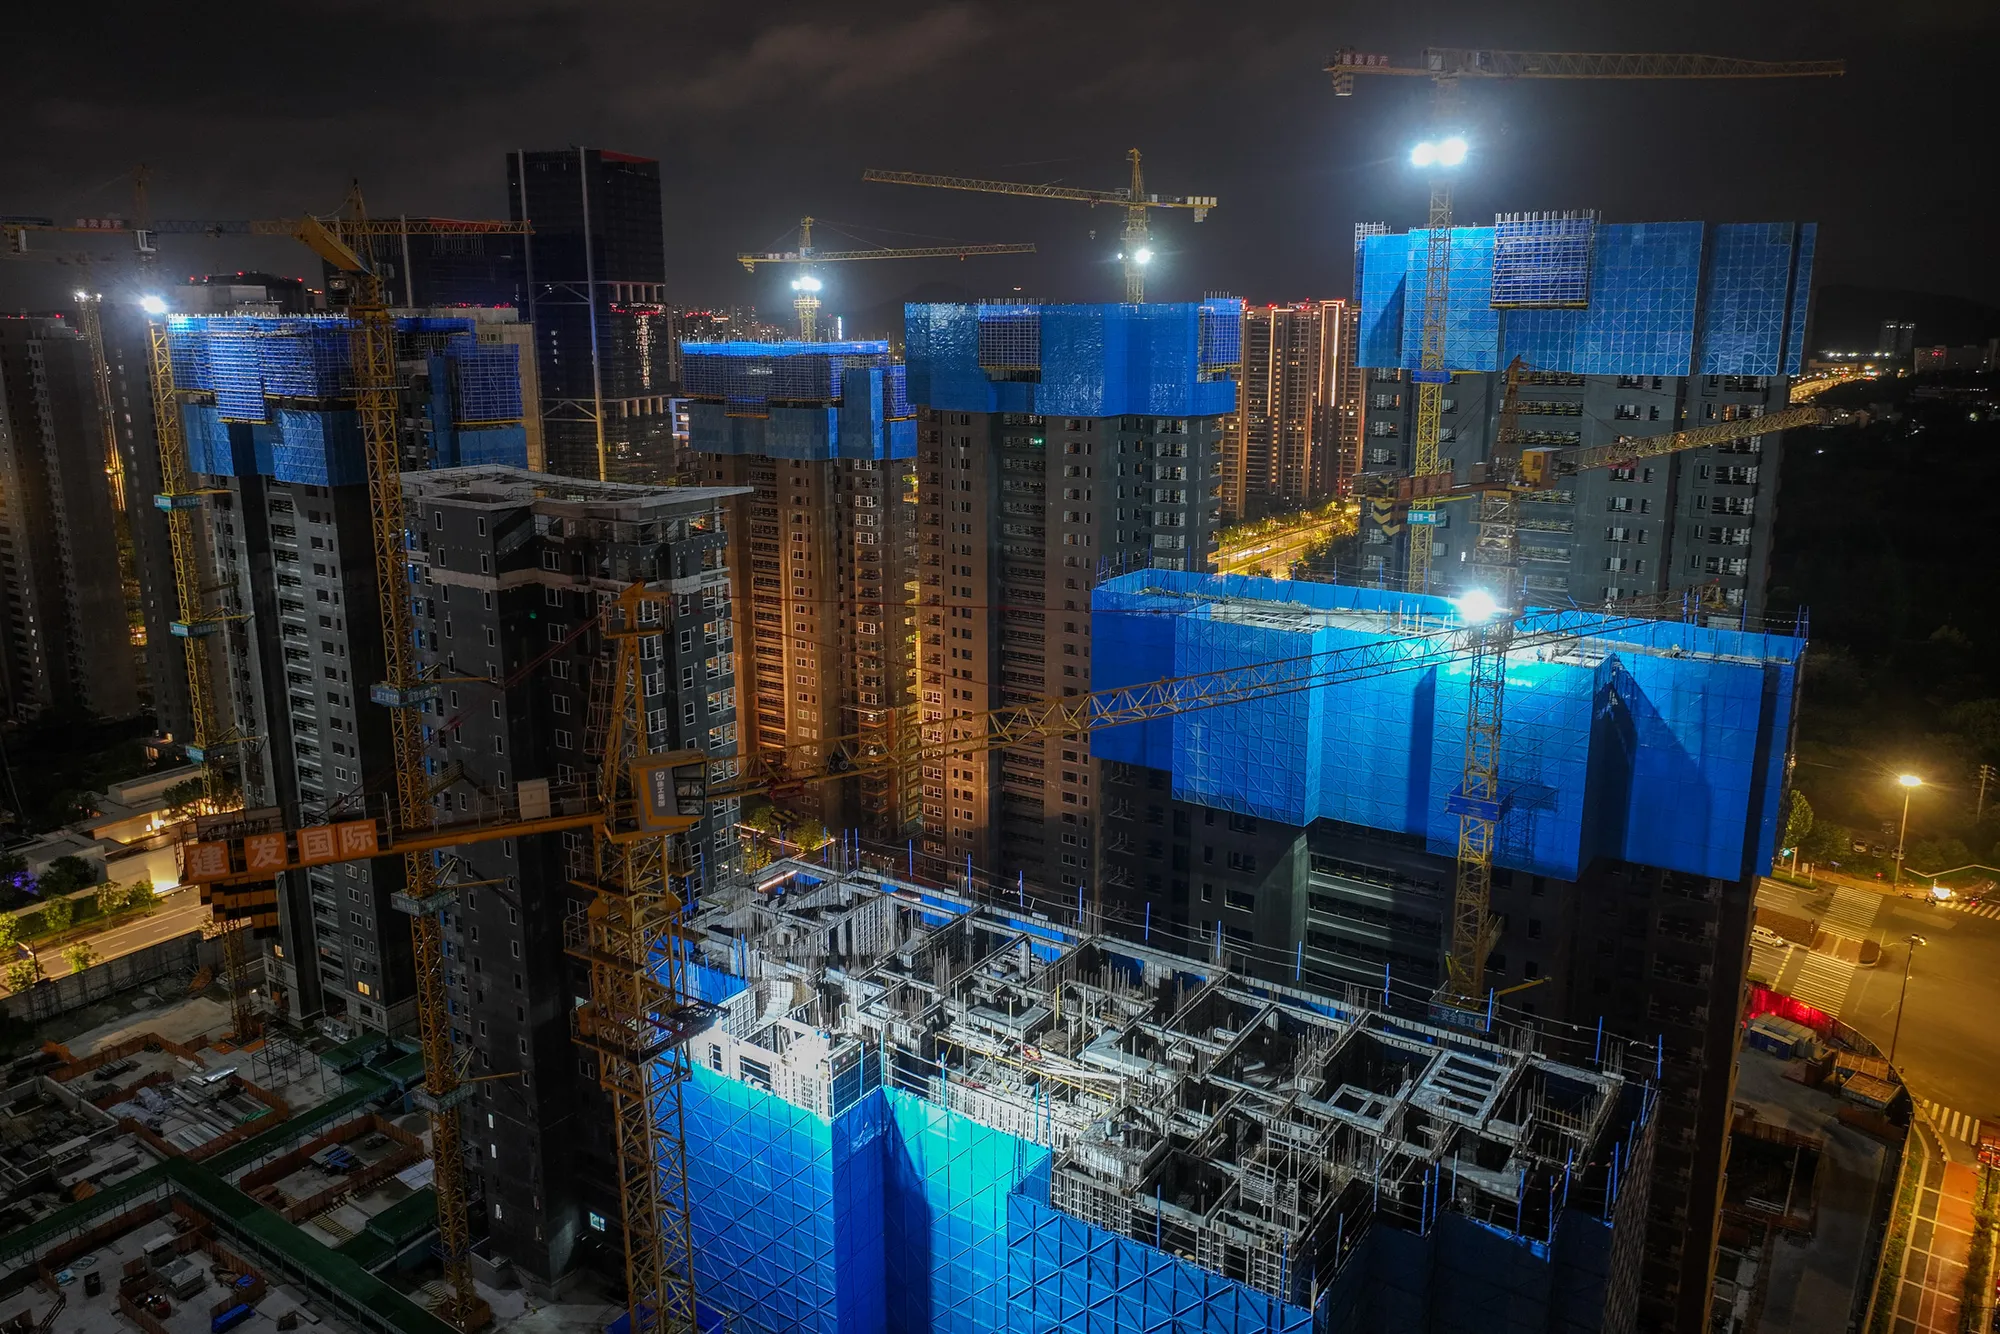
Melbourne spent 3 years doing nothing but underneath the flat prices, something else was happening. Cranes were going up. Tunnels were being bored. Hospitals were being built. People were arriving in their tens of thousands. And rentals were tightening to levels the city hadn’t seen in a decade. These Melbourne suburbs aren’t sitting at a discount because they’re broken or behind. They’re sitting at a discount because Melbourne as a whole took a long nap — and the market hasn’t yet priced in what’s already been built, confirmed, and funded all around them.
At NextHouse, we follow the infrastructure, the vacancy rates, and the planning decisions — not the headlines and right now, every one of those signals is pointing in the same direction.
FAQs
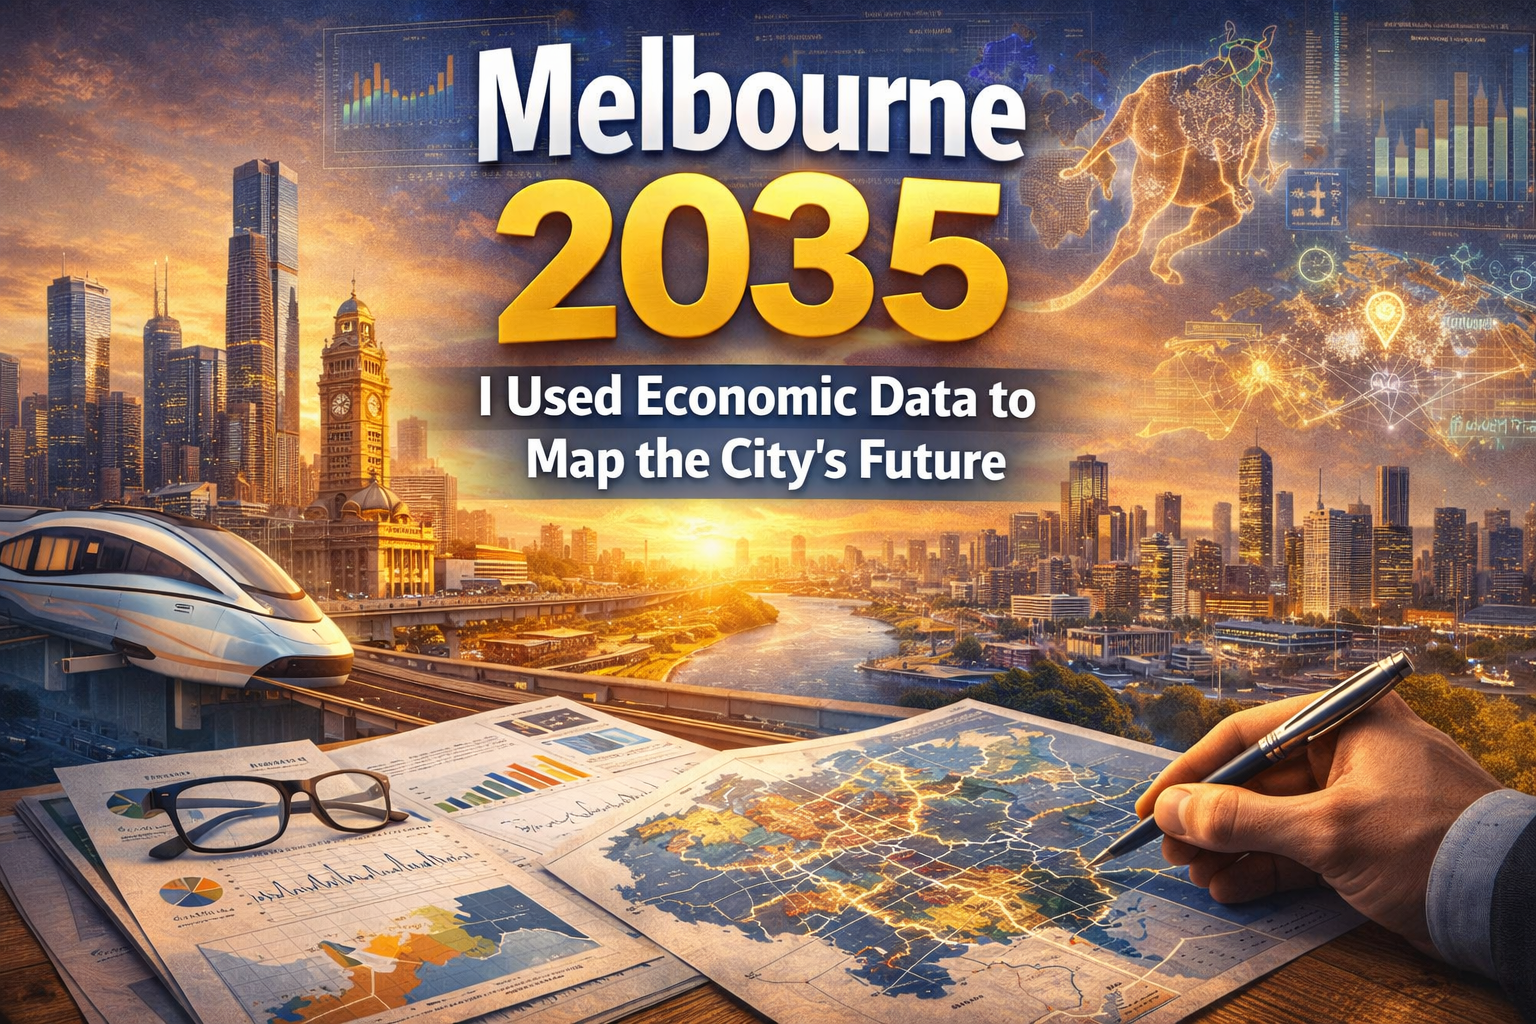
- Is Melbourne actually going to grow in 2026?
Six of the biggest forecasters in the country — KPMG, Domain, Westpac, ANZ, PropTrack, and NAB — are all pointing at 5 to 7%+ growth, with KPMG’s +6.6% the strongest projection for any Australian capital city. - Which actually makes more sense in these suburbs right now?
Genuinely depends on what you’re trying to do. Houses in Epping, Dandenong, and Werribee sitting below $750,000 offer strong capital growth potential as the infrastructure catalysts play out over the coming years. Neither is universally the smarter choice — it entirely depends on your holding period, your borrowing capacity, and the specific outcome you’re working toward. - What’s the actual downside here if Melbourne doesn’t perform the way the forecasts suggest?
No forecast is a guarantee, and if anyone tells you otherwise walk away. Markets respond to things nobody predicted — global economic shocks, unexpected rate movements, policy changes that upend the calculus overnight. - How do I actually know when a suburb’s window has properly closed?
The clearest marker is when the suburb’s median crosses Melbourne’s city-wide average — currently sitting at around $947,000. That’s the point at which the discount-to-median opportunity is fully absorbed and the straightforward catch-up trade is done. Springvale at $930,500 growing at 9.5% crosses that line within 12 months. Frankston at $832,000 growing at 11.5% is on an almost identical timeline. - Do I actually need a buyer’s agent for any of these suburbs?
Not a hard requirement — but seriously worth thinking about in the markets where competition is already getting heated. At an absolute minimum, whatever you decide: independent building inspection, vendor’s statement read cover to cover, and a licensed financial adviser consulted before anything gets signed.
Disclaimer: This report is for educational and informational purposes only. It does not constitute financial, investment, or legal advice. Always seek professional advice before making property decisions.