
Everyone’s talking about China’s property crash. Evergrande is gone. Vanke is bleeding. And if you’ve spent any time reading Australian property news lately, someone has probably told you that what’s happening in Beijing is about to land on your doorstep in Melbourne. The story sounds airtight — Chinese developers collapse, iron ore demand drops, the Australian dollar weakens, the budget tightens, interest rates rise, and your suburb takes the hit. Clean. Simple. Wrong. The data tells a very different story — and once you see where the chain actually breaks, you’ll stop watching Evergrande headlines and start watching the one number that’s actually moving Melbourne in 2026.
The four numbers that frame this story: China’s Property Crash
You’ve probably seen the headline. China’s property market is imploding. Evergrande collapsed. Vanke is bleeding billions. Here are four numbers that tell the real story before we even start.
- One. China’s real-estate development investment fell 17.2% in 2025 — its fifth straight year of decline, and the sharpest fall yet. (China NBS, January 2026.)
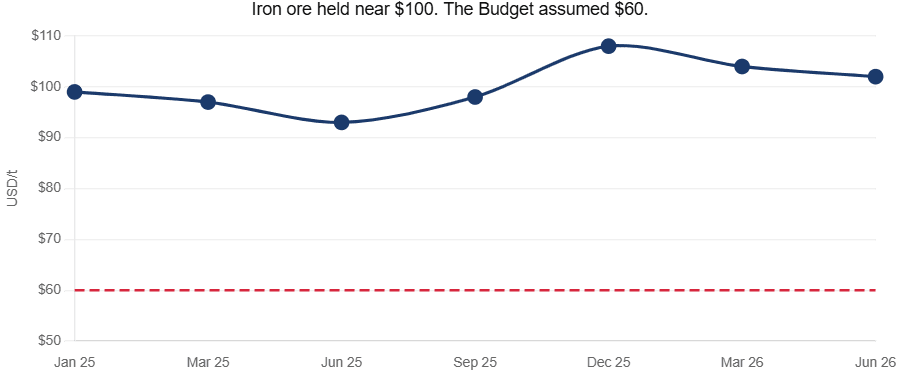
- Two. The iron ore price barely moved. The 62% Fe benchmark traded around US$100 a tonne through 2025 and into mid-2026 — well above the conservative US$60 the federal budget assumes. (Platts/SGX; Australian Treasury.)
- Three. A US$10-per-tonne swing in iron ore changes Commonwealth tax receipts by just A$0.3 billion in the near term. Against a budget of more than A$700 billion, that’s a rounding error. (Treasury MYEFO sensitivity analysis.)
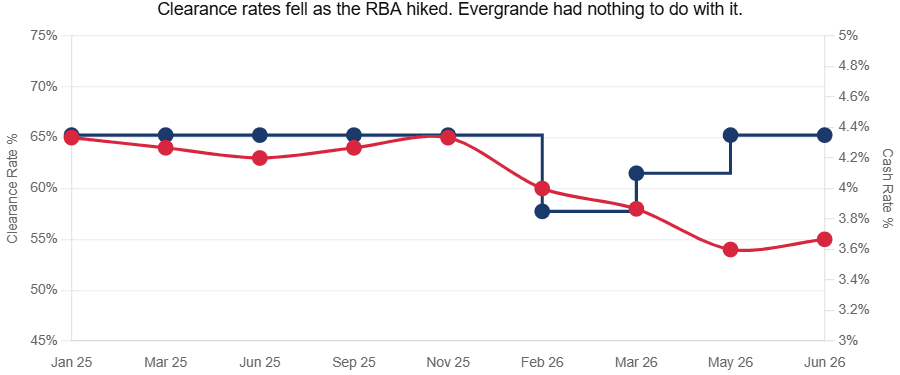
- Four. What’s actually moving Melbourne in 2026? The RBA cash rate — lifted to 4.35% by May to fight a fuel-driven inflation shock. Melbourne’s auction clearance rate has slid into the mid-50s as a result. (RBA; Cotality/REIV.)
The Honest Verdict
The story that sells is simple: Chinese developer collapses → iron ore craters → Australian dollar falls → budget blows out → interest rates rise → Melbourne house prices fall. Clean. Logical. Easy to publish.
Every link in that chain exists. Each one is real. But the signal bleeds away at every step. China’s property crash did reduce steel demand — but manufacturing and infrastructure absorbed a big chunk of the blow. Weaker steel demand should have killed iron ore — but inventory restocking and new African supply kept prices near US$100. A weaker iron ore price should have dragged the dollar — but gold, copper and interest rate gaps dominated currency markets in 2025–26. And the link the popular story relies on most — that a tighter budget forces higher interest rates — is just not how the RBA works.
By the time you reach a Melbourne auction, almost nothing of the original signal survives. And in 2026, the chain has been overridden entirely. Melbourne is softening because the RBA is hiking rates into a Middle East fuel shock. That has nothing to do with Evergrande. The one China connection that does reach Melbourne directly is Chinese buyer demand — and on the official numbers, that’s small and getting smaller.
Where the chain actually breaks?
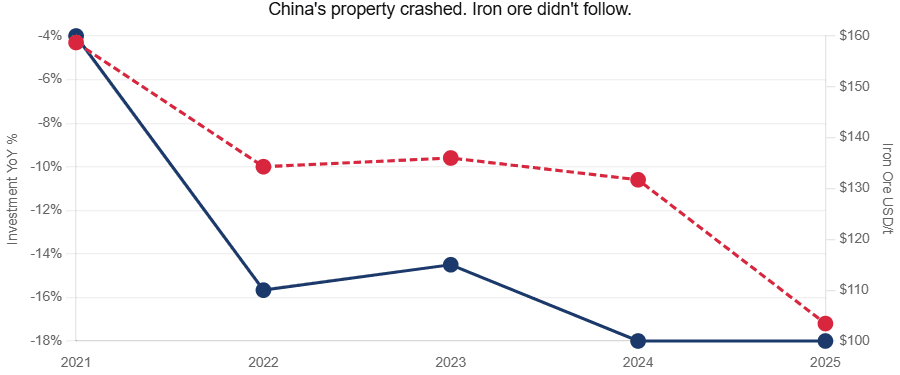
Chinese property investment didn’t drift lower in 2025 — it fell off a cliff, down 17.2% in a single year. If the chain worked the way people say it does, iron ore should have collapsed alongside it. It didn’t. The benchmark held near US$100 a tonne. The very first link — China property to iron ore — already loses most of its signal. Everything downstream inherits that leak.
Here’s how each link in the chain grades out:
| Link in the chain | Strength | What the data actually shows | |
|---|---|---|---|
| 1 | China property → steel demand | Strong | Property is still ~half of China’s steel use, but construction’s share has nearly halved since 2010 |
| 2 | Steel demand → iron ore price | Moderate | 2025 steel output fell ~10%, but prices held near US$100 on restocking and supply |
| 3 | Iron ore price → AUD | Moderate | Long-run correlation is ~0.76, but gold, copper and yields dominated in 2025–26 |
| 4 | AUD / iron ore → export income | Strong | Iron ore is Australia’s #1 export (~A$116b in 2024–25); 27.1% of the RBA commodity index |
| 5 | Export income → budget | Strong but small | A US$10/t shift moves receipts by ~A$0.3b near-term |
| 6 | Budget → interest rates | Weak / misframed | The RBA targets inflation and jobs, not the budget |
| 7 | Interest rates → Melbourne prices | Strong — but domestic | Rates drive Melbourne, but 2026 hikes are about a fuel shock, not China |
Source: NextHouse analysis. Primary sources cited throughout.
Link 1 — Evergrande and Vanke: what really happened
Let’s start where the story starts — two names that have become shorthand for the biggest property unwind in modern history.
Evergrande: from the world’s most indebted developer to a delisted shell
China Evergrande Group — once valued at US$51.7 billion at its 2017 peak — was delisted from the Hong Kong Stock Exchange on 25 August 2025. It had been suspended since a January 2024 winding-up order. The company collapsed in 2021 with more than US$300 billion in debt. Eighteen months after liquidation began, creditors had filed 187 claims totaling US$45 billion — and recoveries stood at just US$255 million. Most of Evergrande’s assets sit on the mainland, beyond the reach of offshore liquidators. Offshore bondholders are expected to recover almost nothing.
Vanke: when the distress reached the “safe” one
If Evergrande was the warning shot, Vanke is the confirmation that no Chinese developer is truly safe. Vanke — historically the largest homebuilder by sales, backed by the Shenzhen government — reported a 2025 net loss of 88.6 billion yuan, 79% wider than the year before. It survived 2025 only because its state-linked shareholder, Shenzhen Metro, injected 31.5 billion yuan in emergency loans. That tap has since been capped. S&P and Fitch downgraded Vanke to selective default and restricted default respectively after a string of near-misses on bond payments. (Caixin, 1 June 2026.)
| Measure | China Evergrande | China Vanke |
| Status | Delisted from HKEX, 25 Aug 2025 | Listed; in distressed restructuring |
| Peak/scale | US$51.7b market cap (2017) | Largest homebuilder by sales |
| Total liabilities | US$300b+ at collapse (2021) | More than US$50b |
| Creditor claims | 187 claims totaling US$45b | 6.7b yuan bond maturities by mid-2026 |
| 2025 outcome | US$255m assets sold in 18 months | Net loss 88.6b yuan; ratings ‘default’ |
| State backing | None — offshore bondholders wiped | Shenzhen Metro: 31.5b yuan, now capped |
Source: NPR/CNBC/LSEG (Evergrande); Caixin 1 June 2026 (Vanke).
The national picture: five years of decline
These aren’t isolated failures. China’s National Bureau of Statistics reported that full-year 2025 real-estate development investment came in at 8,278.8 billion yuan — down 17.2%. New residential starts fell 19.8%.
| China property indicator (full-year 2025) | Value | YoY change |
| Real-estate development investment | 8,278.8 billion yuan | -17.2% |
| New residential floor space started | 429.84 m² | -19.8% |
| Completions | — | -18.1% |
| New commercial-building sales value | 8,393.7 billion yuan | -12.6% |
| Residential sales value | — | -13.0% |
| Residential sales area | 732.99 m² | -9.2% |
Source: China National Bureau of Statistics, full-year 2025, released 20 January 2026.
This link — China property in deep, sustained decline — is not in dispute. It’s everything after it where the story falls apart.
Link 2 — Steel and construction demand
China makes more than half the world’s steel. Property has long been its biggest customer. So a crash in China’s property sector should mean a crash in steel demand — and a crash in demand for the iron ore Australian mines.
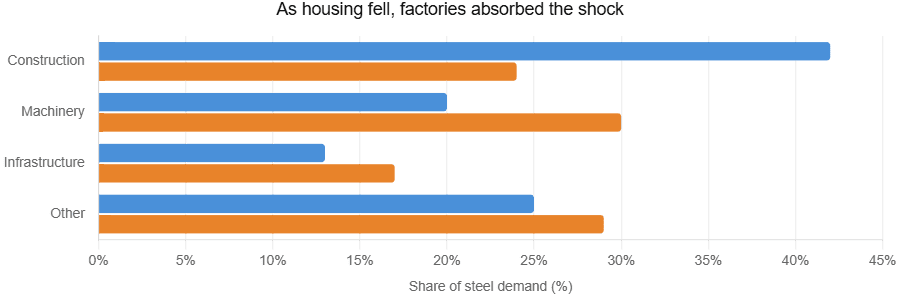
The first half of that holds. The second half is where it gets complicated. Construction and real estate still account for over half of China’s steel use. But the property-specific slice has shrunk dramatically. As housing fell away, the Chinese steel machine partly re-pointed itself at factories, shipyards, the electricity grid and EV production.
Chinese crude steel production did fall — roughly 10% year-on-year in late 2025, with December output at 68.2 million tonnes (worldsteel). But the fall was smaller than the property headlines suggested, and China’s record steel exports — more than 97 million tonnes in the first ten months of 2025 alone — kept mills running at higher rates than the domestic demand collapse would have implied.
Link 3 — The iron ore price that refused to fall
Here’s the link that surprises most people. Chinese steel output fell around 10%. Iron ore should have gone with it. Two things kept prices elevated:
- First , Chinese steel mills rebuilt inventories. Port stocks rose above 160 million tonnes. Ore demand and finished steel demand are not the same thing in any given quarter — mills stockpile.
- Second , supply matters as much as demand in commodity pricing. Guinea’s massive Simandou iron ore mine is ramping up in 2026. The softening bank consensus for the year is as much about new supply as Chinese weakness.
| 2026 iron ore forecast (62% Fe, US$/t) | Forecaster |
| US$85 | Citi |
| US$90 | Fitch |
| US$93 | Goldman Sachs |
| US$94 | Market consensus |
| US$95 | BMI / JPMorgan |
| US$100 | Vale |
Source: GMK Center consensus; broker notes. Forecasts, not realized prices.
The takeaway: iron ore is not a clean read-through of Chinese property. Watching Evergrande headlines to predict the iron ore price will get you wrong as often as right.
Link 4 — The Australian dollar
The RBA openly describes the Australian dollar as a “commodity currency.” The long-run correlation between the AUD and iron ore is around 0.76 — which is high. In principle, weaker iron ore means a weaker dollar.
In 2025–26, that link got drowned out by other forces.
The RBA’s Index of Commodity Prices rose 12.8% in the year to March 2026 — but the Bank said the gains came mainly from gold, lithium, coking coal and rural commodities, not iron ore. The dollar traded around US$0.71 in mid-2026, supported by record gold prices and the interest rate gap as the RBA hiked.
“Iron ore down, dollar down” is a real tendency. In 2025–26 it was just not the one running the show.
Link 5 — Export income and the federal budget
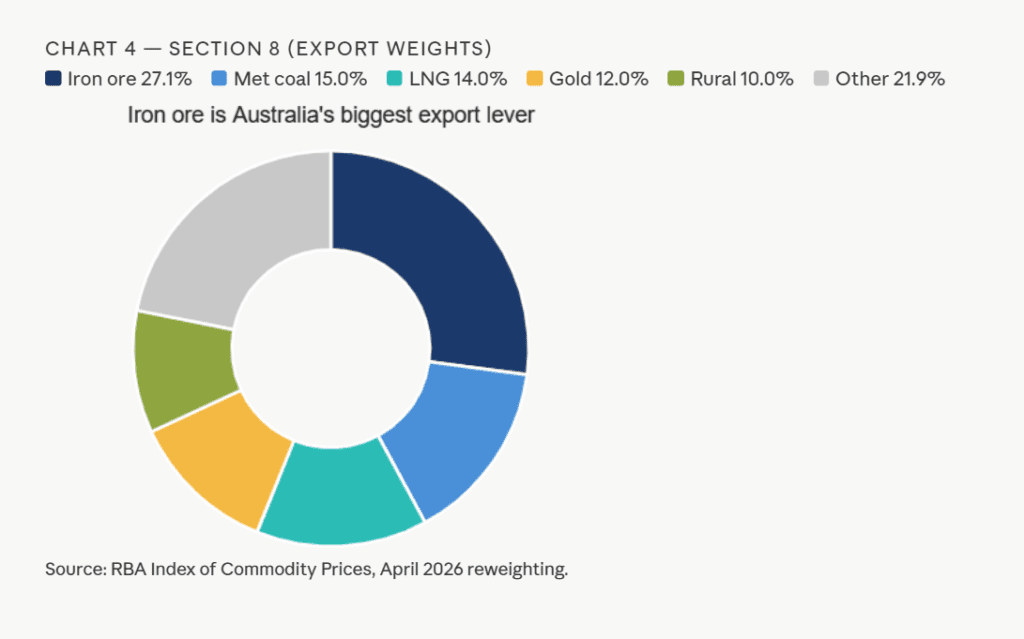
This is the link that is both genuinely real and genuinely overblown — because it’s precisely quantified. Iron ore is Australia’s single largest export, worth about A$116 billion in 2024–25. It carries 27.1% of the RBA’s commodity index — ahead of metallurgical coal, LNG and gold combined.
When the iron ore price moves, national income and company tax move with it. But how much? Treasury publishes the answer. A US$10-per-tonne change in the assumed iron ore price shifts tax receipts by about A$0.3 billion in each of the next three years, rising to A$1.9 billion by 2028–29.
| Financial year | Receipts impact of a US$10/t iron ore change |
| 2025–26 | +A$0.3 billion |
| 2026–27 | +A$0.3 billion |
| 2027–28 | +A$0.3 billion |
| 2028–29 | +A$1.9 billion |
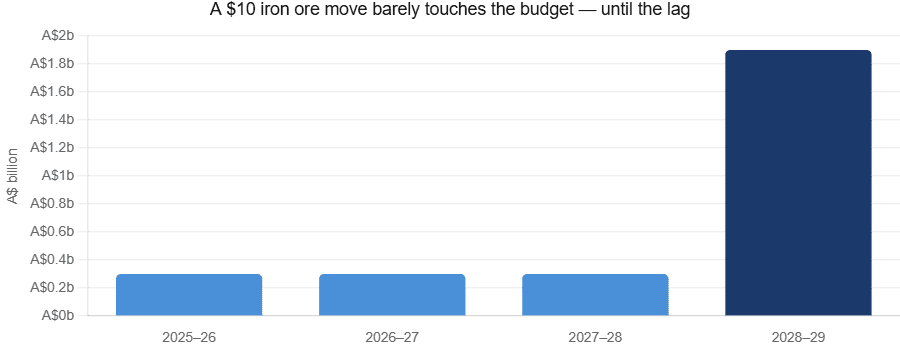
Source: Australian Treasury, MYEFO sensitivity analysis.
Against a Commonwealth budget north of A$700 billion a year, a few hundred million dollars is real money. It is not a macroeconomic event. Iron ore running near US$105 against a budget assumption of US$60 quietly delivered a smaller 2024–25 deficit than forecast — but it did not reshape the economy.
Watch — “Two Global Crises Just Hit Your Melbourne Mortgage — And Nobody Is Connecting the Dots”
Link 6 — Interest rates: the link that falls apart
This is where the popular story breaks, and it’s worth being directly about why. The chain usually runs like this: weaker exports → tighter budget → higher interest rates → lower house prices.
That’s not how Australian monetary policy works. The RBA does not set the cash rate to fund the budget. It sets the rate to keep inflation in the 2–3% target band and to support full employment. The federal budget is not an input to that decision in the way the story implies.
There are genuine pathways from China to Australian interest rates — but they run through inflation and national income, and they point in opposite directions depending on which force wins: The net effect is uncertain and empirically small. And 2026 proves the point completely. The Board’s own language was clear: underlying inflation would stay above 3% until late 2027.
| 2026 RBA decision | Cash rate | Stated driver |
| February 2026 | 3.85% | Rising inflation risk |
| March 2026 | 4.10% | Fuel shock, second-round effects |
| May 2026 | 4.35% | Underlying inflation above 3% to late 2027 |
Source: RBA cash rate decisions and Statement on Monetary Policy, 2026.
The link the chain depends on didn’t just weaken in 2026 — it ran in the opposite direction.
Link 7 — What’s actually moving Melbourne in 2026
The last link does work — interest rates quietly drive Melbourne clearance rates and prices. But in 2026, the rates moving Melbourne have nothing to do with Evergrande.
Melbourne residential values fell 0.6% in April 2026 — a second consecutive monthly fall, putting values roughly 1.9% below the November 2025 peak (Cotality). The weekly auction clearance rate slid into the mid-50s, well below the ~65% that signals a balanced market. The national final clearance rate hit 50.4% in May 2026 — the lowest since the pandemic shutdown of May 2020.
| Melbourne market reading (2026) | Figure |
| Dwelling values, April 2026 | -0.6% (2nd consecutive monthly fall) |
| vs. November 2025 peak | approx. -1.9% |
| Median dwelling value | approx. A$822,969 |
| Weekly auction clearance | mid-50s % (vs ~65% balanced) |
| National final clearance, May 2026 | 50.4% (lowest since May 2020) |
| Primary driver | RBA hikes, affordability, listings, Budget changes |
Source: Cotality Home Value Index and clearance data, 2026; R.B.A.
Cotality attributes the softening to 75 basis points of rate hikes, stretched affordability, rising listings, weak sentiment, and the May 2026 Budget’s negative gearing and CGT changes. Every one of those is domestic. None of them is a Chinese developer.
[YouTube embed: https://www.youtube.com/watch?v=fjnlA2YRRbk — “Melbourne Property Hit a 4 Year Low — Why the RBA’s May 5 Decision Changes Everything”]
The real China–Melbourne connection: Chinese buyers
If the macro chain bleeds away to almost nothing, is there any China link that actually reaches Melbourne? Yes — and it’s the one the macro story usually ignores.
Chinese buyers are the number-one foreign source of approved residential real estate investment in Australia, by both number and value, in every recent measured period. Victoria — and Melbourne specifically — is the largest or equal-largest destination state, concentrated in inner-city apartments and off-the-plan stock near the CBD and universities.
But honesty requires the numbers.
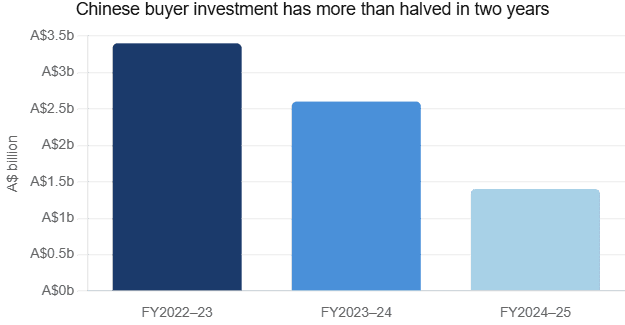
| Chinese residential investment (FIRB approvals) | Value |
| FY2022–23 | A$3.4 billion |
| FY2023–24 | A$2.6 billion |
| FY2024–25 | A$1.4 billion (1,355 proposals) |
| Total foreign residential approvals, FY2024–25 | A$4.9 billion |
| Foreign approvals as share of annual settlements | approx. 0.8% |
| China’s share of annual turnover | approx. 0.2% |
Source: Foreign Investment Review Board (FIRB). Approvals reflect investor intentions and may overstate actual purchases.
That 0.2% is a national average. It hides real impact in specific Melbourne precincts — CBD and Carlton apartments, Box Hill, Glen Waverley, Clayton near Monash. And a national ban on foreign purchases of established dwellings, effective 1 April 2025 through mid-2029, has further pushed foreign buyers toward new supply only. Tripled FIRB fees have deterred many others.
The honest read: if you want a China signal that actually touches Melbourne, watch off-the-plan apartment demand in those specific suburbs — not the iron ore price.
The bull case: five reasons China still matters
Pillar 1 — Iron ore is still the keel of the budget. At ~A$116 billion and 27.1% of the RBA’s commodity index, iron ore underwrites national income. A sustained slide below US$80 a tonne would dent receipts, the dollar and confidence in ways that eventually reach housing through sentiment and policy headroom.
Pillar 2 — The terms-of-trade channel is real, just slow. Lower national income compounds over years. A weaker dollar feeds imported inflation. Weaker mining investment hits WA and Queensland first — but the income drag is national.
Pillar 3 — Confidence travels faster than steel. Markets don’t wait for the transmission chain. A fresh Evergrande-scale headline can dampen Australian buyer and investor sentiment within days, softening auction turnout well before any commodity number changes.
Pillar 4 — The direct buyer channel is concentrated, not trivial. A sub-1% national share hides real forces in specific Melbourne precincts. China’s property crash has destroyed enormous household wealth. That can cool off-the-plan demand in exactly the suburbs that depend on it.
Pillar 5 — Policy room is the hidden link. A genuine China-driven earnings shock would, over time, give the RBA room to cut and Treasury reason to stimulate. That easier policy would lift Melbourne. The link exists — it’s just slower and more conditional than the headline implies.
The bear case: five reasons it’s overstated
Risk 1 — Each link carries the signal. Property is half of Chinese steel use; construction’s share has been halved; steel is part of iron ore demand; iron ore is a quarter of exports; exports are a small budget swing. Multiply those fractions and very little reaches a Melbourne auction.
Risk 2 — Supply, not China, sets the iron ore price now. With Simandou ramping, the 2026 iron ore story is increasingly about new tonnes, not Chinese demand. The price can fall for reasons that have nothing to do with Evergrande — and hold up despite it.
Risk 3 — The currency link is unreliable. In 2025–26, gold, copper and yield differentials drove the dollar, not iron ore. Anyone trading the AUD off Chinese property headlines would have been repeatedly wrong.
Risk 4 — The “budget to rates” link is a myth. The single most common version of this chain describes a mechanism the RBA simply does not operate. In 2026 rates rose because of a fuel shock, nothing to do with China.
Risk 5 — Domestic forces dominate Melbourne. Rate settings, the May 2026 Budget’s tax changes, listings, migration and affordability explain Melbourne’s 2026 softness without any reference to China. Attributing local price moves to Evergrande mistakes a faint signal for the main event.
Three playbooks — owner-occupier, investor, first-home buyer
Profile A — The owner-occupier
For someone buying a home to live in, the China chain is close to noise. What matters is the RBA cash rate, your borrowing capacity, and the supply picture in your specific suburb. The data shows 2026 softness is rate-driven and domestic. Budget your purchase against a 4.35% cash rate and the possibility of further moves — not against Chinese steel headlines. If someone tells you “the China crash will crush Melbourne,” ask them about your suburb’s listing volumes and local clearance rate instead.
Profile B — The investor
The China link that should be on your dashboard is the direct one, not the macro one. Off-the-plan apartment demand in CBD, Carlton, Box Hill, Glen Waverley and Clayton is truly sensitive to Chinese buyer wealth and to where foreign flows are being redirected. Approved Chinese investment has more than halved since 2022–23. That’s a headwind for high-density stock in those specific precincts — and largely irrelevant to detached housing in the middle ring.
Profile C — The first-home buyer
The useful signal in this whole chain is the interest rate one — and it currently points to caution on borrowing capacity, not opportunity. Clearance rates in the mid-50s and falling values can widen your buying window — but only if rates stabilise. The RBA expects underlying inflation above 3% until late 2027. Don’t assume cuts are coming soon. Watch the RBA, not Evergrande.
Watch: “Melbourne First Home Buyers Just Borrowed $560K — Most Will Regret It”
The NextHouse View
China’s property crisis is real. And yes, it is Australia’s business — at least in part. But the everyday version of this story sells a clean pipeline that the data simply doesn’t contain. Every link in the chain exists. Every link bleeds away most of its signal. A 17.2% collapse in Chinese property investment left iron ore sitting near US$100. A US$10 iron ore move barely troubles the federal budget. And the link the popular telling leans on hardest — that a tighter budget forces higher interest rates — isn’t how the RBA operates.
In 2026, the proof is sitting right there in the numbers. Melbourne is softening because the RBA is hiking into a fuel shock. Not because of Evergrande. The one China link that does reach Melbourne directly is Chinese buyer demand — and on the official FIRB numbers, that’s around 0.2% of national turnover, concentrated in a handful of high-density precincts, and falling.
The honest conclusion isn’t “China’s crisis will crush Melbourne.” It’s: watch the RBA and your suburb’s supply first. Then — only if you’re exposed to off-the-plan apartments in Box Hill, Carlton or Clayton — watch what’s happening to Chinese household wealth.
Disclosure: NextHouse does not accept paid placement from developers, agents, lenders or any third party.
FAQs
- Does China’s property crash affect Australian house prices?
Indirectly — and weakly. The collapse in Chinese property investment reduces steel and iron ore demand, which can soften Australia’s export income, dollar and budget. But the data shows the signal bleeds away at every step. In 2026, Melbourne’s price moves are driven by domestic interest rates, not China. The one direct link — Chinese demand for Australian homes — is around 0.2% of national turnover and shrinking. - Why didn’t the iron ore price fall when Chinese steel demand dropped?
Two reasons. Chinese mills rebuilt inventories, keeping ore demand elevated even as finished steel output fell roughly 10%. And the iron ore price is set as much by supply — including Guinea’s new Simandou mine — as by Chinese demand. - Does a weaker Chinese economy mean lower Australian interest rates?
Not reliably. The RBA targets inflation and jobs — not the budget. A China-driven income shock could be disinflationary (lowering rates) or, via a weaker dollar, inflationary (lifting rates). In 2026 the RBA raised rates to 4.35% to fight a fuel shock with no connection to China. - Are Chinese buyers still influencing Melbourne prices?
Far less than commonly assumed, and less every year. Approved Chinese residential investment fell from A$3.4 billion in 2022–23 to roughly A$1.4 billion in 2024–25 — about 0.2% of national turnover. A foreign ban on purchasing established dwellings has applied since 1 April 2025. The impact is real but concentrated in specific high-density Melbourne precincts. - Should I factor China into a Melbourne property decision in 2026?
Watch the RBA cash rate and your suburb’s supply picture first — they explain almost all of Melbourne’s 2026 movement. Factor China in directly only if you’re exposed to off-the-plan apartments in precincts with historically high Chinese buyer demand. The macro “China crash” chain is too leaky to act on.
References
- China National Bureau of Statistics. ‘Statistical Communiqué of the PRC on the 2025 National Economic and Social Development.’ February 2026.
- Mingtiandi. ‘Evergrande to Delist as Liquidators Reveal $45B in Debt Claims.’ 2025.
- CNBC/LSEG. China Evergrande Group market capitalization and liabilities, 2017–2025.
- S&P Global Ratings; Fitch Ratings. China Vanke credit rating actions, 2025–2026.
- Shanghai Metals Market (SMM).
- BHP. ‘Visualized: China’s Steel Demand Through Time.’ July 2024.
- world steel association. Short Range Outlooks, October 2025 and April 2026.
- Platts/SGX. Iron ore 62% Fe CFR China benchmark price series, 2025–2026.
- GMK Center; Citi; Goldman Sachs; BMI; JPMorgan; Vale; Fitch. 2026 iron ore price forecasts.
- ‘Drivers of the Australian Dollar Exchange Rate.’ RBA Explainer.
- RBI. ‘Index of Commodity Prices — March 2026.’ Statistical release and April 2026 reweighting.
- Reserve Bank of Australia. Statement on Monetary Policy and cash rate decisions, February–May 2026.
- Australian Government. ‘Mid-Year Economic and Fiscal Outlook — Part 5: Sensitivity Analysis.’
- Cotality (CoreLogic). Home Value Index and auction clearance data, Melbourne, 2026.
- Australian Government. Ban on foreign purchases of established dwellings, effective 1 April 2025 to 30 June 2029.
Related Reading
- NextHouse — How the RBA cash rate path is reshaping Melbourne suburbs in 2026
- NextHouse — The Melbourne West and Tarneit corridor: where the growth is going
- NextHouse — APRA’s debt-to-income wall and what it means for borrowing capacity
- NextHouse — Melbourne Activity Centers rezoning (GC252): the suburb-by-suburb impact
- NextHouse — CGT and negative gearing after the May 2026 Budget
- NextHouse — Off-the-plan apartment demand: the precincts most exposed to foreign buyers
- NextHouse — Iron ore, the dollar and the budget: a plain-English guide
- NextHouse Free Reports — Get the monthly Global Trigger brief (email sign-up)
Disclaimer
This article is general information only. It is published by NextHouse as an information service under the ASIC s.911A(2)(eb) exemption. NextHouse does not hold an Australian Financial Services Licence (AFSL) or Australian Credit Licence (ACL). Nothing in this article is financial, credit, investment, tax or legal advice, and nothing here is a recommendation to buy, sell or hold any property or asset. Before acting on anything you read here, please speak to a licensed financial advisor, registered tax agent, or an MFAA- or FBAA-accredited mortgage broker about your own situation.