
Most people think Melbourne property moves because of what’s happening in Melbourne suburbs. Interest rates. Auction clearance rates. New listings. Local stuff. China’s property market is collapsing to half its peak value. And a military strike that shut down one of the world’s most critical oil shipping lanes. In this article we have discussed why Melbourne Suburbs Outperform Others in 2026.
None of these made the front page of your local real estate section. But every single one of them is flowing through to specific Melbourne postcodes — through currency movements, migration patterns, construction costs, interest rates, and where nervous global capital decides to park itself when the world gets unstable.
This is how global events become suburb-level opportunities. And right now, the signal is loud enough to act on.
First, the Melbourne Snapshot — March 2026
Before the global stuff, here’s where Melbourne actually stands. Melbourne is still the weakest performing capital city. But underneath that flat average, individual Melbourne suburbs are diverging sharply. Three global triggers explain exactly why — and which postcodes are moving next.
| Metric | Figure | Source |
| Melbourne median house price | $977,579 (Feb 2026) | Cotality HVI |
| Melbourne 12-month growth | +4.8% — weakest capital city | Cotality HVI |
| AUD/USD rate | ~US$0.70 (up from US$0.5955 low) | NAB FX |
| Australian CPI (Jan 2026) | +3.8% | ABS, Feb 2026 |
| RBA cash rate | 4.10% (hiked Feb & Mar 2026) | RBA, Mar 2026 |
| Next RBA hike forecast | 4.35% — May 2026 | All 4 major banks |
| Net overseas migration | 306,000 persons (FY2024–25) | ABS, Dec 2025 |
| Construction cost growth | +2.5% annual (+31.3% since COVID) | Cotality Cordell |
| China property sales 2025 | ¥8.4T (vs ¥18.2T peak in 2021) | NBS China |
| Brent crude oil peak | ~US$126/barrel (March 2026) | EIA |
How Global Events Actually Reach Your Street
When something blows up on the other side of the world — a trade war, a currency crash, an oil route shutting down — it doesn’t just stay over there. It travels. It moves through specific channels, at different speeds, until it quietly shows up in the price of a house on a street in Dandenong or Sunshine or Broadmeadows.
| Channel | How It Works | Timing |
| Currency | Weaker AUD makes Australian property cheaper for foreign buyers overnight | Days |
| Migration | Global instability redirects people to Australia, settling near community hubs | 6–18 months |
| Inflation & rates | Energy shocks push CPI up. RBA responds with rate hikes | 3–9 months |
| Construction costs | Shipping disruptions raise material costs. Fewer new homes get built | 6–24 months |
| Capital flight | Global uncertainty drives money toward stable markets like Australia | 1–3 years |
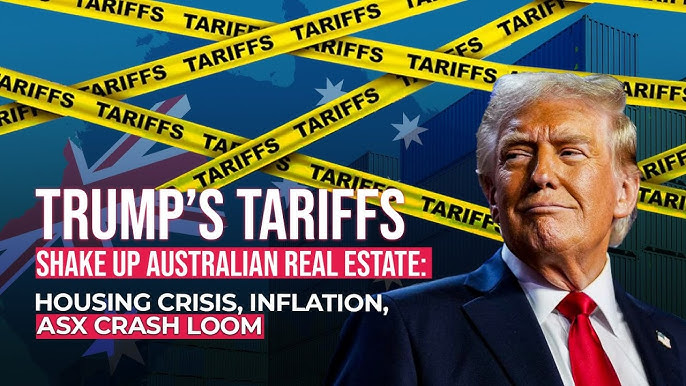
Trigger One — US Tariffs and Melbourne’s Industrial Belt
In April 2025, the Trump administration imposed a 10% baseline tariff on most Australian goods. Steel and aluminium were hit with 25% tariffs under existing Section 232 rules, with some cumulative rates reaching 50% by June 2025. The US Supreme Court struck down the original framework in February 2026 — but the administration immediately replaced it with a new 10% Temporary Import Surcharge. The tariff environment isn’t going away.
The immediate effect on Australia was a currency shock. The AUD crashed to US$0.5955 on 3 April 2025 — a 12% single-day collapse that made Australian property approximately 12% cheaper overnight for any buyer holding US dollars, Hong Kong dollars, or currencies pegged to the USD. The AUD has since recovered to around US$0.70, but the underlying tariff tension means another currency drop is always one policy announcement away.
The less obvious effect is what economists call import substitution — when tariffs make imported goods more expensive, domestic manufacturers suddenly become competitive again. And that’s creating real, measurable employment demand in Melbourne’s industrial corridors.
| Suburb | Median | 12mo Growth | Yield | Rating |
| Sunshine | $796,000 | +9.6% | 3.2% houses / 4.8% units | HIGH |
| Dandenong | $734–752.5K | +3.8–4.9% | 3.7% houses / 5.43% units | HIGH |
| Clayton | $1,200–1,300K | +8.6–14.3% | 2.8% houses / 4.8% units | MODERATE |
Sunshine at $796,000 — The Metro Tunnel gives it direct CBD connectivity. And with nine percent-plus annual growth already running, Sunshine is capturing the employment tailwinds from both logistics demand and domestic manufacturing coming back onshore.
Dandenong’s case is made concrete by one single data point: the $116 million Walkinshaw Automotive plant that opened November 2025, converting US-spec vehicles from left-hand to right-hand drive.
Trigger Two — China’s Property Crash and Melbourne’s Eastern Suburbs
Here’s a number worth sitting with. China’s total property sales in 2025 reached ¥8.4 trillion. That’s not a slowdown. That’s a 54% collapse in the world’s largest property market. Evergrande was delisted from the Hong Kong Stock Exchange in August 2025 carrying debts above US$300 billion. Country Garden is trying to slash its offshore debt by 78%. S&P projects another 6–7% fall in Chinese property sales in 2026. The crisis shows no signs of bottoming.
What does this mean for Melbourne suburbs? When wealthy Chinese families watch their domestic property investments lose half their value, they look for somewhere safe to put what’s left. Australia — stable, transparent, rule-of-law, with established Chinese communities — consistently ranks as the number one offshore destination for Chinese property seekers according to Juwai IQI.
But here’s the important nuance. FIRB-approved Chinese residential investment has already plunged from about $3.4 billion in 2022–23 to just $0.4 billion in 2024. Capital controls from Beijing, plus Australia’s foreign buyer surcharges and the temporary ban on foreign purchases of established dwellings (April 2025 to March 2027), have significantly constrained fresh offshore investment. The buyers coming now are predominantly Chinese-Australians with permanent residency — not fresh offshore capital.
That distinction matters enormously for which suburbs benefit.
China Trigger Suburbs
| Suburb | Median Price | 12mo Growth | China-Born % | Chinese Ancestry % | Rating |
| Box Hill | $1,480,000–$1,500,000 | +6–8% | 29.5% | 46.6% | DUAL — opportunity and risk |
| Glen Waverley | $1,655,000–$1,727,000 | +5.5% | 17.8% | 38% | STABLE — community-anchored |
| Clayton | $1,200,000–$1,300,000 | +8.6–14.3% | 23.0% | ~35% | HIGH — Monash hub, SRL advancing |
The critical distinction is community-driven versus investor-driven demand. Box Hill at 46.6% Chinese ancestry has deep community infrastructure — hospitals, schools, specialist retail, established social networks — that sustains demand even when offshore investment falls.
Glen Waverley’s $380,000 school-zone premium — documented by Beckett Property — is effectively a China-driven price floor. Chinese-Australian families competing for Glenn Waverley Secondary College catchment are motivated by education, not investment returns. That’s a structurally more stable buyer cohort than offshore investors chasing capital gains.
Trigger Three — The Strait of Hormuz and Melbourne’s Northern Suburbs
For Melbourne suburbs with significant Middle Eastern communities, there’s a third and more direct effect — migration.
- Broadmeadows — $620,000–$635,000 Melbourne’s highest Lebanese ancestry concentration at 9.6%, Turkish at 5.6%, Arabic spoken by 16.5% of residents. Sitting 36% below Melbourne’s median with house yields at 4.11% and units at 5.31%. This is where the Middle East trigger lands most directly.
- Coburg — ~$1,180,000 Lebanon-born community of 2.2% anchored by the iconic Sydney Road cultural strip. Growing at +7.3% annually and gentrifying fast. A moderate Middle East connection with strong cultural infrastructure keeping demand steady.
- Dandenong — $734,000–$752,500 Australia’s most culturally diverse LGA. Islam is the largest religion at 37.7%, with significant Afghan, Iraqi, and Sri Lankan communities. Unit yields running at 5.43%. A natural first-landing suburb for humanitarian entrants from multiple Middle Eastern source countries.
Where Multiple Triggers Converge — The Strongest Case
The most compelling opportunities are where two or three triggers hit the same Melbourne suburbs simultaneously
| Suburb | Score | Triggers Firing | Why |
| Dandenong | 21/30 — STRONG | Tariffs + China + Middle East | Walkinshaw factory + diverse migrant community + NEIC + $2B masterplan |
| Sunshine | 17/30 — STRONG | Tariffs + Middle East | Western industrial corridor + logistics reshoring + Airport Rail |
| Clayton | 17/30 — STRONG | China + Tariffs | Monash NEIC + Chinese student hub + SRL most advanced station |
| Broadmeadows | 16/30 — MODERATE | Middle East | Migration anchor + airport logistics + 36% below median |
| Box Hill | 14/30 — MODERATE | China | Deepest Chinese community + SRL East — unit oversupply is the risk |
The Headwinds — Where to Be Careful
These triggers don’t create winners everywhere. The same forces working in favour of some suburbs are actively working against others.
| Segment | Risk | Key Data Point |
| Melbourne CBD apartments | China pullback + rate hikes | 40.7% sold at a loss. Median unit $473,483 — 28.2% below Greater Melbourne average |
| Box Hill high-rise | FIRB investment collapsed | Chinese investment: $3.4B → $0.4B. Units down 5.71% year-on-year |
| Premium suburbs $1.5M–$2M+ | RBA rate hikes | Cash rate 4.10%, heading 4.35%. Every 25bp cuts borrowing capacity by ~2.5% |
| Outer growth corridors | Oversupply + rate hikes | 1,894 construction insolvencies. Vacancy running 3–5% |
The Single Number Worth Watching — Rental Vacancy Rate
Same rule applies here as everywhere else in Melbourne property right now. Before you look at anything else in these suburbs, check the rental vacancy rate on SQM Research. It’s the market’s earliest warning signal — the thing that moves before prices do.
| Suburb | Vacancy Rate | What It Signals |
| Dandenong | ~0.7% | Extreme undersupply — 3× below Melbourne average |
| Broadmeadows | ~1.2% | Well below average — demand running ahead |
| Sunshine | ~1.2% | Below average — industrial workforce rental pressure |
| Clayton | ~1.5% | Below average — student and research workforce demand |
| Coburg | ~1.8% | Below average — gentrification pressure building |
When vacancy is this low, the sequence is already running: rents rise, yields improve, more buyers enter, prices follow. Every time.
4 Things to Watch Going Forward
If you want to track global triggers before they show up in property prices, these are the four signals worth monitoring.
Watch the AUD/USD rate. When the AUD moves more than 5% in a quarter, offshore buyer affordability shifts significantly. A renewed tariff escalation or Hormuz-driven energy shock could push it lower again — reopening the foreign buyer advantage for industrial corridor suburbs.
Check ABS Overseas Migration quarterly releases. Track which countries are sending the most people to Australia. Map those source countries to established diaspora communities in Melbourne. That’s your forward demand indicator.
Monitor copper futures. Copper above US$13,000 per tonne means construction cost pressure is building. That constrains new housing supply within 12 to 18 months — tightening the market for existing stock in undersupplied Melbourne suburbs.
Follow Victoria’s Big Build project status. Confirmed infrastructure projects operate independently of global disruption. The SRL, the Metro Tunnel, the Sunshine Superhub — none of these get cancelled because of a Middle East crisis. Match confirmed infrastructure to the suburbs already benefiting from global demand triggers and you’ve found the strongest combined thesis.
The Affordability Tipping Point — All Suburbs Together
| Melbourne Suburb | Median | 12mo Growth | Global Trigger | Risk Level |
| Broadmeadows | $620–635K | +6.4–7.9% | Middle East — HIGH | STRONG opportunity |
| Dandenong | $734–752.5K | +4.9% | All three triggers | STRONGEST convergence |
| Sunshine | $796K | +9.6% | Tariffs + Middle East | STRONG |
| Clayton | $1,200–1,300K | +8.6–14.3% | China + Tariffs | STRONG |
| Coburg | ~$1,180K | +7.3% | Middle East — MODERATE | MODERATE |
| Box Hill | $1,480–1,500K | +6–8% | China — HIGH | DUAL — opportunity + risk |
| Glen Waverley | $1,655–1,727K | +5.5% | China — STABLE | Rate-sensitive |
Conclusion
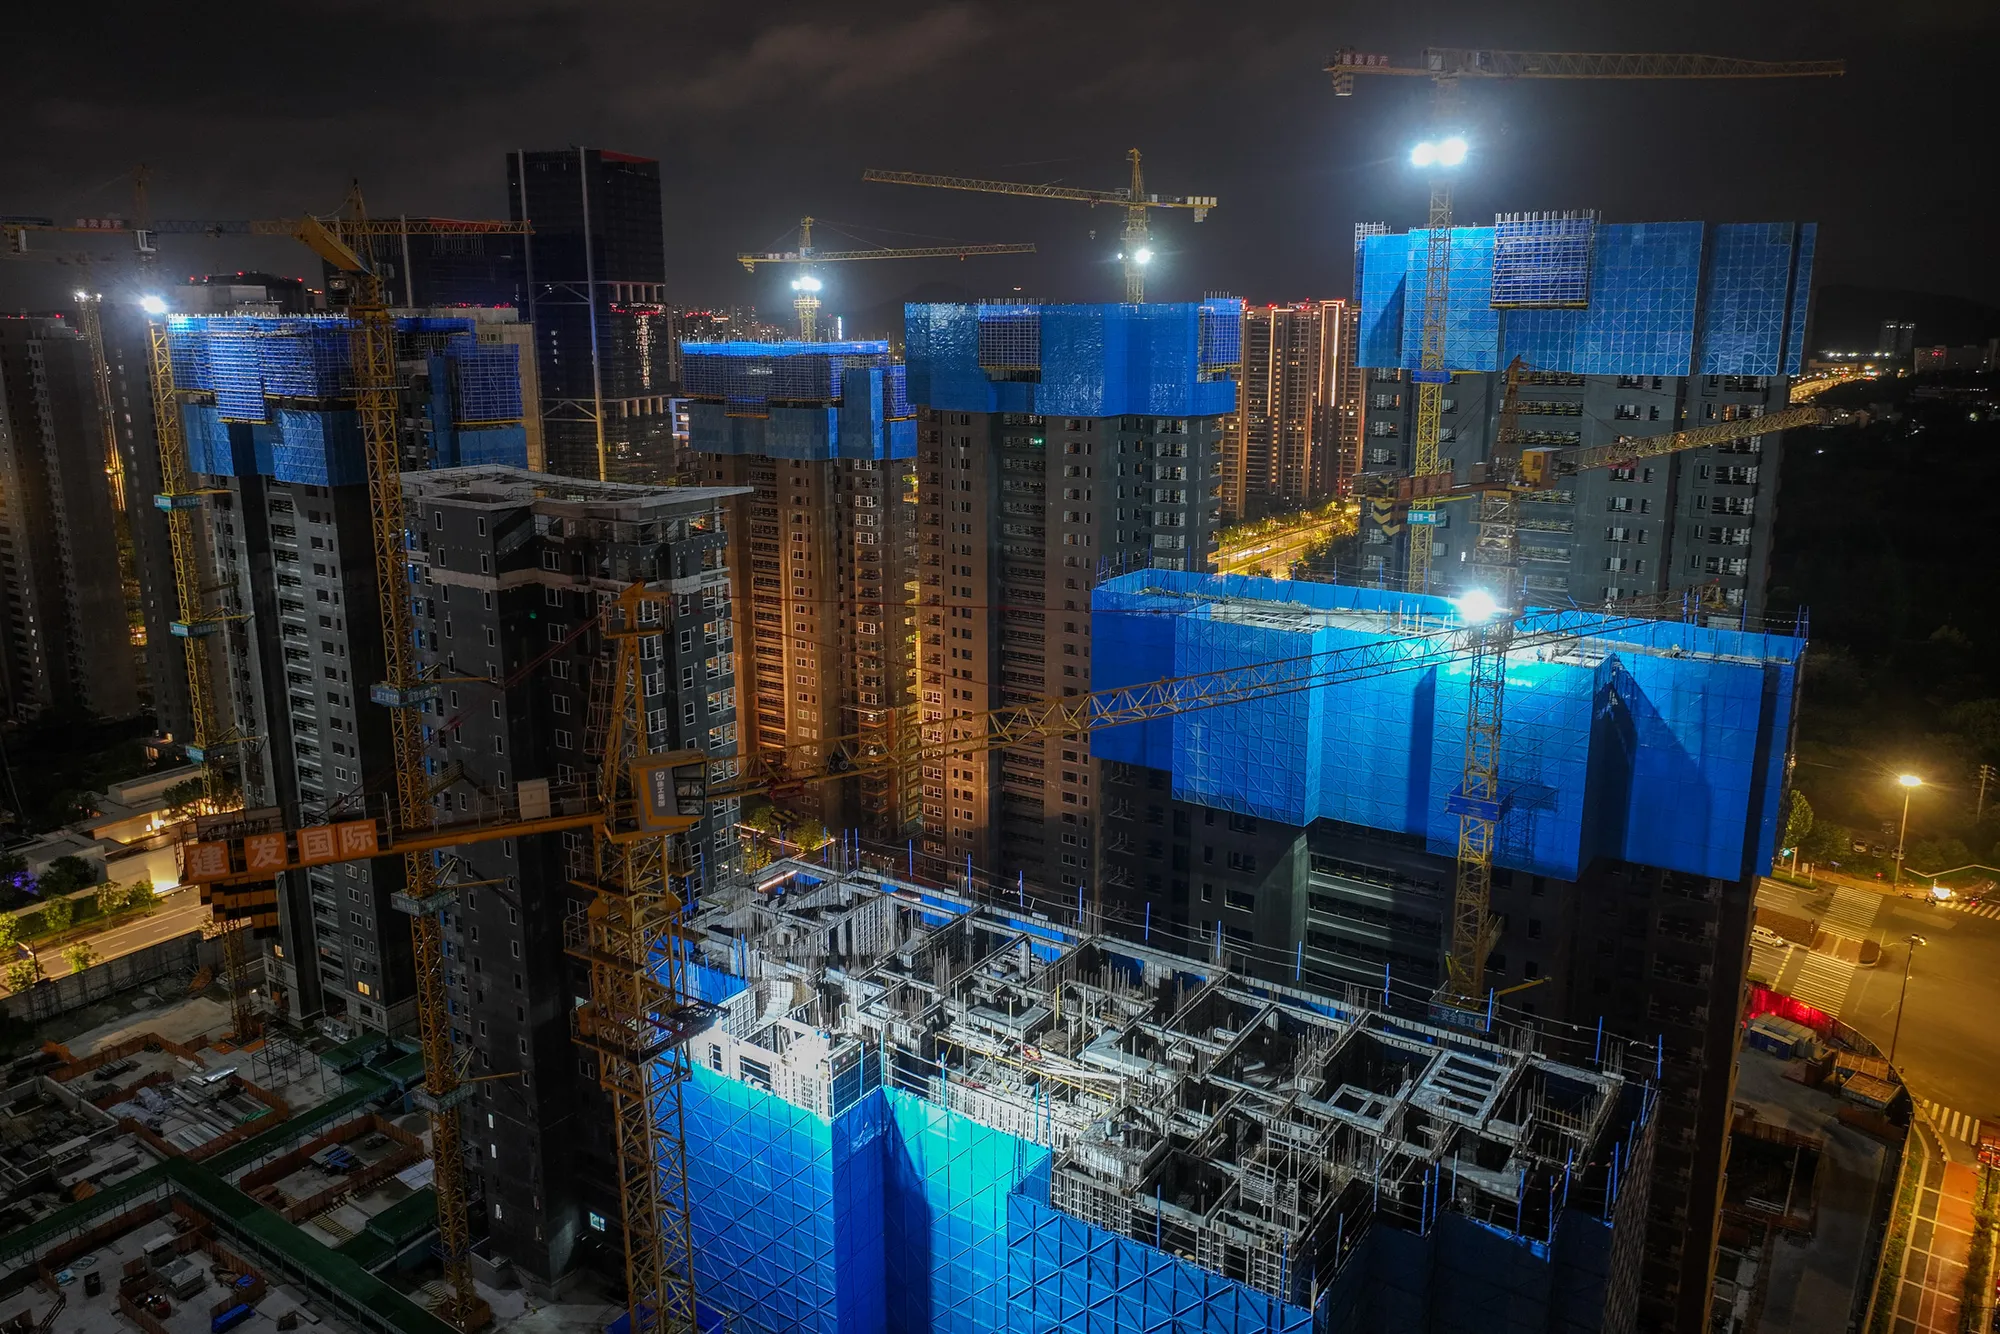
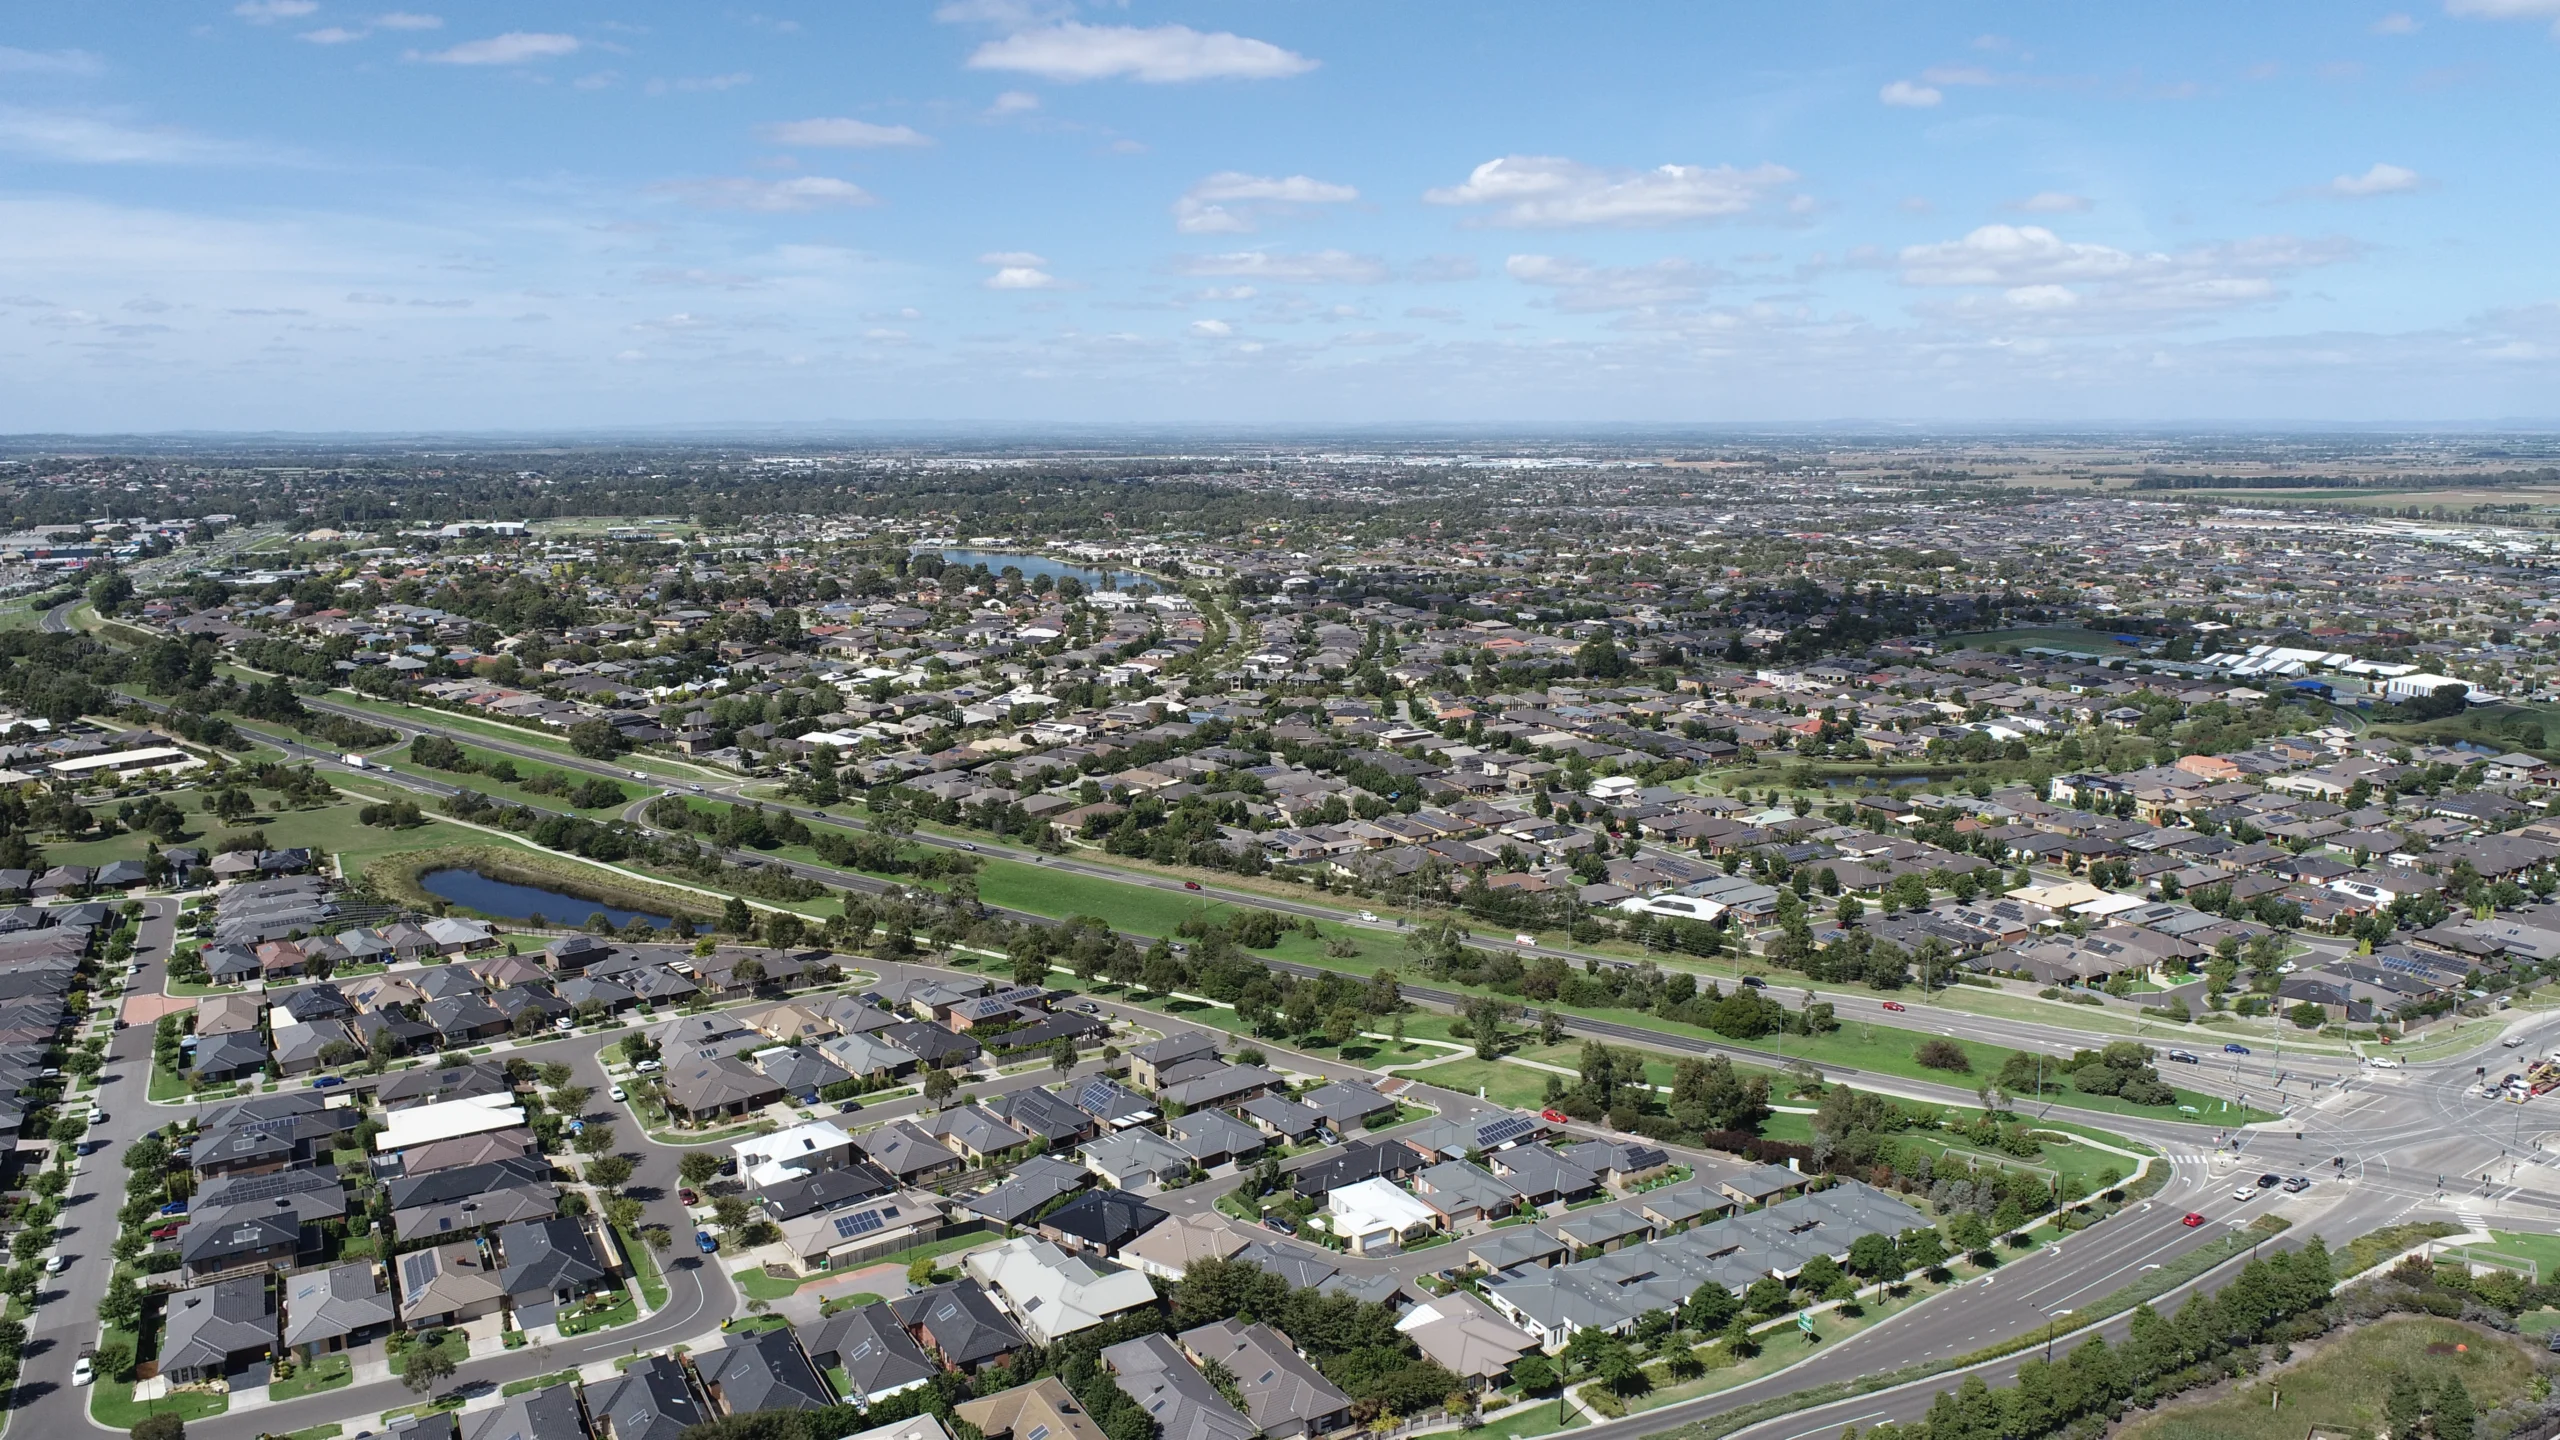
Melbourne went sideways for three years while the rest of the country ran ahead. But underneath those flat prices, something else was happening. Cranes were going up. Tunnels were being bored. People were arriving in their tens of thousands. Global capital was getting nervous and looking for somewhere stable to land.
The three global triggers in this analysis — US tariffs, China’s property collapse, and the Hormuz closure — aren’t temporary noise. They’re structural forces that will continue reshaping Melbourne’s suburb-level demand patterns for months and years ahead. The Strait remains effectively closed. China’s property market shows no signs of bottoming. US tariff policy continues to evolve.
The investors who profit from this won’t be the ones who waited for the headlines to catch up. They’ll be the ones who learned to read the global signal and trace it to the local street. At NextHouse, that’s exactly what we do.
Disclaimer: This report is for educational and informational purposes only. It does not constitute financial, investment, or legal advice. Always seek professional advice before making property decisions.