
Here’s the whole idea in one breath: when a couple splits, one household becomes two. That’s one extra home needed, every single time. Multiply that across the roughly 160,000 Australian couples who separate each year, and you get a steady, quiet stream of new housing demand that never really stops — and a steady stream of “forced” listings on the other side, as shared homes get sold off.
Right now, in 2026, high interest rates are doing something interesting: some couples can’t actually afford to split up. So this whole engine is running slower than usual — which is just one more reason Melbourne’s housing supply feels tighter than it should.
This piece walks through the numbers, who it actually hits hardest, and where in Melbourne this shows up.
What is the “divorce economy”, really?
Think of it like this. Two people share one roof. They split up. Now you need two roofs. That’s it — that’s the entire mechanism. It sounds almost too simple to matter. But run that math across the whole country, year after year, and it adds up to a genuine, permanent source of housing demand — one that property economists have known about for decades but rarely explain in plain English.
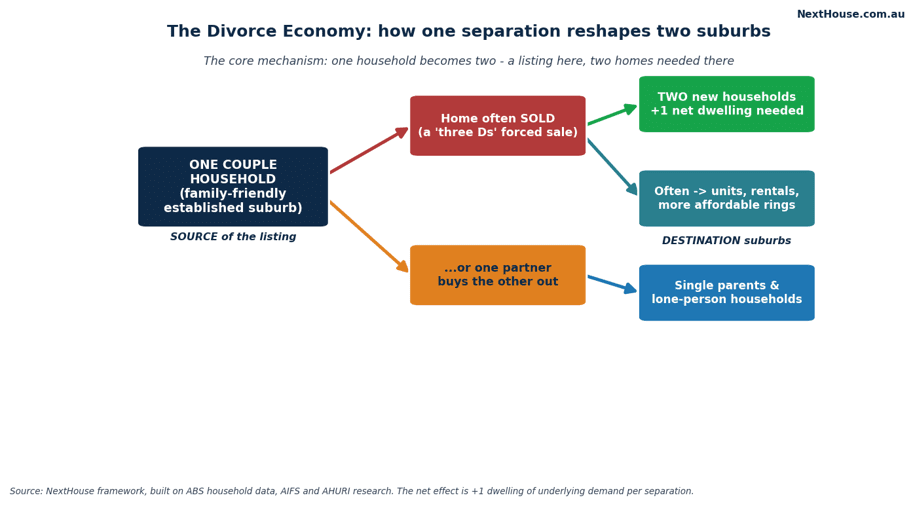
Source: NextHouse framework, based on ABS household data and AIFS research.
The number nobody talks about
Most people only hear about divorce statistics — about 48,000 registered divorces a year in Australia. That number’s actually been falling for two decades. So if that were the whole story, this would be a pretty small deal.
But here’s the catch: that number only counts married couples who legally divorce. It completely misses de facto couples who split up — and there are a lot more of them. Once you add estimated de facto separations on top of registered divorces, total relationship break-ups in Australia likely run past 160,000 a year.
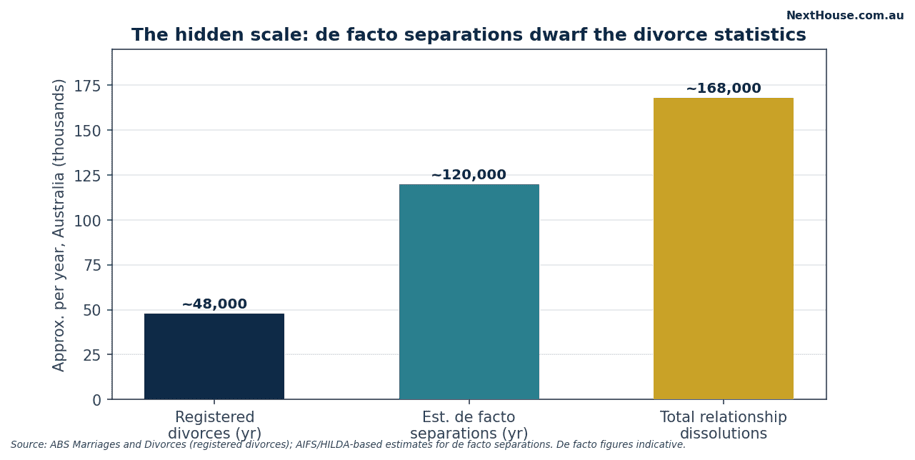
| Measure | Roughly per year | Notes |
| Registered divorces | ~48,000 | Has been falling for 20 years (ABS) |
| Estimated de facto separations | ~120,000 | Not officially counted — estimate based on AIFS/HILDA data |
| Total relationship break-ups | ~160,000+ | The number that actually matters for housing |
| Extra homes per split | ~1 | One household, divided into two |
Table source: ABS Marriages and Divorces; AIFS/HILDA-based estimates. De facto figures are estimates, not registered counts.
Why one split always needs two homes?
Here’s the part that makes this a property story instead of just a social one. Either way, that home often leaves the “couple” market. Meanwhile, both people now need somewhere to live — usually somewhere smaller, and usually somewhere cheaper than the home they shared.
So the maths looks like this: one listing goes onto the market, but demand for two homes gets created. Net effect? About one extra home needed, every time.
| What happens | Effect on supply | Effect on demand |
| Right away | Family home often gets listed | Two people now need separate homes |
| Net effect | One home returns to market | Two homes needed — net gain of one |
| Typical pattern | Settled, family-style suburb | Cheaper, smaller, unit-style suburb |
Table source: NextHouse framework, built on ABS household data and AHURI research.
Why Aussie households keep shrinking?
Here’s a number that quietly explains a lot about why housing always feels short: the average Australian household has shrunk from about 2.9 people in the early 1980s to roughly 2.5 today.
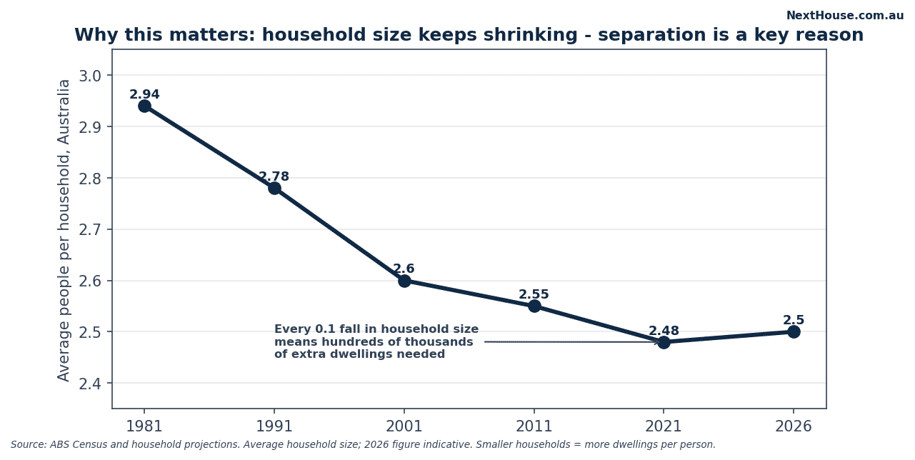
That sounds tiny. It isn’t. Spread across the whole population, a drop like that means hundreds of thousands of extra homes are needed just to house the same number of people — even before population growth is added in.
Separation isn’t the only reason households are shrinking — people are also living alone longer and partnering up later — but it’s a steady part of the trend.
6. Why these listings hit the market no matter what
In real estate, there’s an old saying about the “three D’s” that force people to sell whether they want to or not: death, divorce, and debt.
A separating couple usually has to sell. The asset needs splitting, and neither person can carry the mortgage alone. That makes these listings different from normal ones — they show up steadily, in good markets and bad, because the sellers don’t really have a choice.
There’s even a pattern to it. Family lawyers report a spike in separation enquiries every January — sometimes called “divorce month” — after the pressure of the holidays. That tends to flow into a wave of listings hitting the market by autumn.
| The “three D’s” | Why the sale happens |
| Death | Estate needs settling, assets divided |
| Divorce / separation | Shared asset split; neither can afford it alone |
| Debt | Money pressure forces the sale |
Table source: Industry framing of non-discretionary sale triggers.
Who loses more after a split — and why?
This part of the story isn’t even close to fair. Research using the long-running HILDA survey, along with AHURI studies, keeps finding the same thing: women — especially single mums — take a much bigger hit to homeownership after a split than men do.
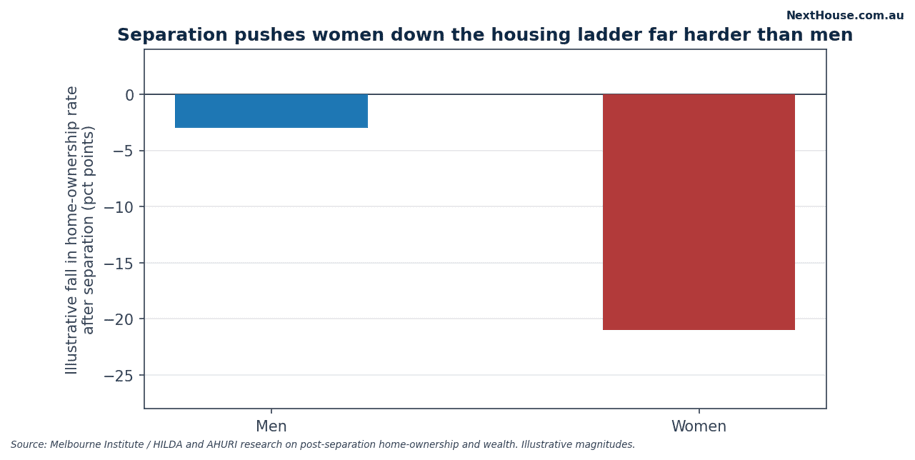
Source: Melbourne Institute / HILDA and AHURI research. Figures are illustrative, not exact.
For the market, this matters because newly-single mums tend to need affordable, well-located family housing — two and three-bedroom units near schools and transport. That’s exactly the kind of “missing middle” housing Melbourne never seems to build enough of.
Where Melbourne’s “newly single” actually move?
This is where it gets local. The listings and the new demand don’t land in the same suburbs — they follow a pattern.
Source suburbs — where the listings come from — tend to be settled, family-style areas: the leafy middle ring, bayside and inner-east family pockets, and established family suburbs out east and north.
Destination suburbs — where people land afterwards — skew toward smaller, cheaper homes: unit-heavy middle-ring areas, apartment precincts near transport and uni, and more affordable outer corridors.
| Who | Typical Melbourne area | Type of home |
| Where listings come from | Family-friendly middle ring, bayside, inner-east | 4-bedroom family homes |
| Higher-income mover | Inner & middle-ring near transport | 2-bed apartments / townhouses |
| Single parent | Affordable middle/outer, near schools | 3-bed units, townhouses |
| “Grey divorce” (older couples) | Downsizer-friendly areas | Low-maintenance units |
| Renter | Rental-heavy middle ring & outer suburbs | Rental units and houses |
Table source: NextHouse suburb framework, built on ABS Census data and AHURI research. A general pattern, not an exact forecast.
Want to see how this plays out suburb by suburb? Check out
Why is 2026 pressing pause on all of this?
Here’s the twist that makes this a 2026 story, not just background trivia. The whole mechanism above assumes a couple can afford to become two households. Right now, with the cash rate at 4.35% and living costs still biting, that’s not always true.
Setting up a second home means a second rent or mortgage — and for stretched households, that’s simply out of reach. So some couples are doing something researchers call “staying together for the mortgage”: the relationship has ended, but the housing hasn’t caught up yet.
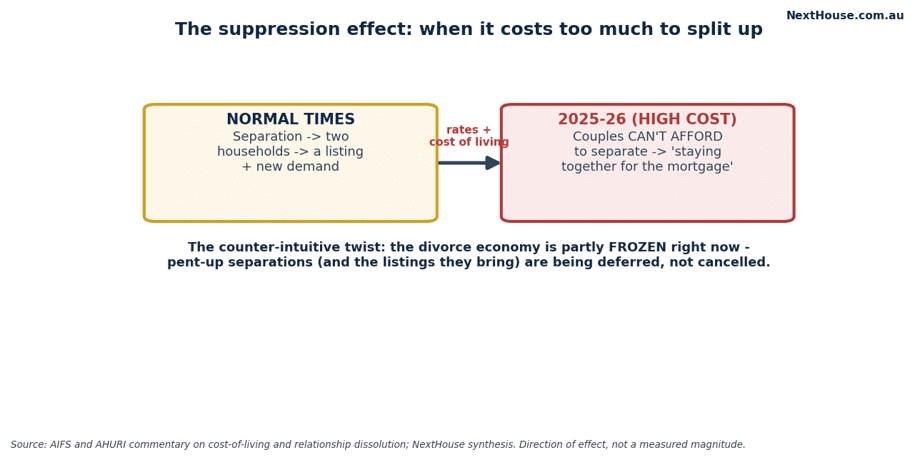
Source: AIFS and AHURI commentary; NextHouse synthesis. Direction of effect, not a measured figure.
These splits aren’t cancelled — just delayed. When rates eventually ease, expect a backlog of postponed separations to release a small wave of new listings and new household demand. It’s another example of something we cover a lot here at NextHouse: almost everything in property eventually moves with the rate cycle.
Five reasons this matters (and five reasons not to overthink it)
Why it’s real:
- Every split adds roughly one home of permanent demand
- It’s steady — it shows up in good markets and bad
- It drives the fastest-growing household types: singles and single-parent families
- It targets exactly the “missing middle” housing Melbourne is short on
- It now moves with interest rates, just like everything else
Why you shouldn’t overstate it:
- It’s still a small slice of any month’s total listings
- Registered divorce rates have actually been falling for years
- Plenty of separations end with one partner keeping the home — no listing at all
- The de facto numbers are estimates, not hard counts
- Right now, the cost-of-living squeeze is muting the whole effect anyway
What this means if you’re an owner, investor, or going through it?
- If you own a family home: this trend is part of why well-located family homes keep finding buyers even in soft markets — there’s steady, structural demand behind them.
- If you’re investing: the real signal is on the destination side. Affordable two and three-bedroom units near schools and transport see durable demand from newly-single households — exactly the housing that’s chronically undersupplied.
- If you’re going through a separation yourself: these are some of the hardest decisions you’ll make, and they deserve proper advice, not a blog post. This article is general information, not personal advice — please speak with a family lawyer, financial adviser, and an MFAA- or FBAA-accredited mortgage broker about your situation.
The NextHouse View
I think the divorce economy is one of the most underrated forces in Australian housing — not because it’s huge, but because it’s permanent. Interest rates move up and down. Migration swings with policy. But the maths of one household becoming two doesn’t go away, cycle after cycle.
What’s genuinely new for 2026 is the suppression effect. We’re watching a backlog build in real time — couples who’ve already decided to split, simply waiting for the budget to catch up. When rates ease, I’d expect that backlog to show up first in rental demand for smaller, affordable homes, well before it shows up in actual sale listings.
People Also Ask
Does divorce really affect house prices?
Not directly, and not much on its own. It adds a steady trickle of listings and demand, but it’s too small a slice of the market to move prices by itself.
Why do divorce rates affect rental demand?
Because newly-single people — especially single parents — usually rent before they buy again, which adds steady pressure to rental markets for smaller, affordable homes.
Are de facto separations counted in divorce statistics?
No. Official divorce numbers only cover legally married couples. De facto break-ups are far more common and are only estimated, not officially counted.
FAQs
- Is the “divorce economy” a real economic term?
Sort of — it’s more an industry nickname than an official term. Property and family-law professionals use it to describe the steady flow of housing activity that separation creates. - Why does January get called “divorce month”?
Family lawyers report a noticeable jump in separation enquiries every January, after the strain of the holiday season. That tends to translate into a wave of listings by autumn. - Will rate cuts cause a flood of divorce-related listings?
Probably not a flood — more a gradual release. Expect a modest, steady increase in listings and rental demand as affordability improves, rather than a sudden spike. - Who’s hit hardest by housing loss after a split?
The data consistently shows women, and single mothers especially, face a bigger and longer-lasting drop in homeownership than men after a separation.
References
- Australian Bureau of Statistics — Marriages and Divorces, Australia
- Australian Bureau of Statistics — Census and Household Projections
- Australian Institute of Family Studies (AIFS) — separation and de facto relationship research
- HILDA Survey (Melbourne Institute) — household and post-separation outcomes
- Australian Housing and Urban Research Institute (AHURI) — housing affordability and relationship breakdown studies
Related reading
- Melbourne’s Missing Middle: Why We Can’t Build Enough Townhouses
- Rentvesting in 2026: How Younger Buyers Are Adapting
- How RBA Rate Cuts Flow Through to Melbourne Property
Disclaimer
This article is general information only and doesn’t take into account your personal situation, finances, or goals. It isn’t financial, legal, or investment advice. NextHouse is independent and not affiliated with any developer, agent, or lender — we don’t earn commissions on property sales. Always speak with a licensed financial adviser, family lawyer, and accredited mortgage broker before making property or legal decisions.