
Brisbane is now $250,000 more expensive than Melbourne. On house medians. With verified data. From Australia’s most trusted property data provider.
And yet the “Brisbane is cheap, Melbourne is overpriced” narrative is still the dominant story in Australian property circles. Buyer’s agents are still selling it. Podcast hosts are still repeating it. It was true in 2021. In 2026, it is flatly wrong — and the gap between the narrative and the data is now a quarter of a million dollars.
That gap is what this article is about. Not just the headline number, but what it actually means for where you put your money right now, at the 4.35% RBA cash rate, with an APRA debt cap tightening the screws and a Federal Budget landing tomorrow that could change the investor tax landscape overnight.
Watch: Will the RBA Hike on Tuesday? Here’s What 4 Major Banks Say
Brisbane vs Melbourne: Which One is Above Now?
Yes. And not just slightly. For 22 straight years — from 2000 to 2022 — Brisbane’s house median traded at roughly 62% to 72% of Melbourne’s. It was structural. It held through multiple rate cycles, multiple booms, multiple property downturns. Brisbane was the more affordable city, full stop.6.26% (Canstar, May 2026), here’s the honest cashflow picture on a $700,000 investor purchase in both cities.
Then the pandemic happened. Then the migration wave hit Queensland. Then the infrastructure pipeline started flowing. And Brisbane ran 85.3% cumulative growth over five years while Melbourne managed 8.5%.
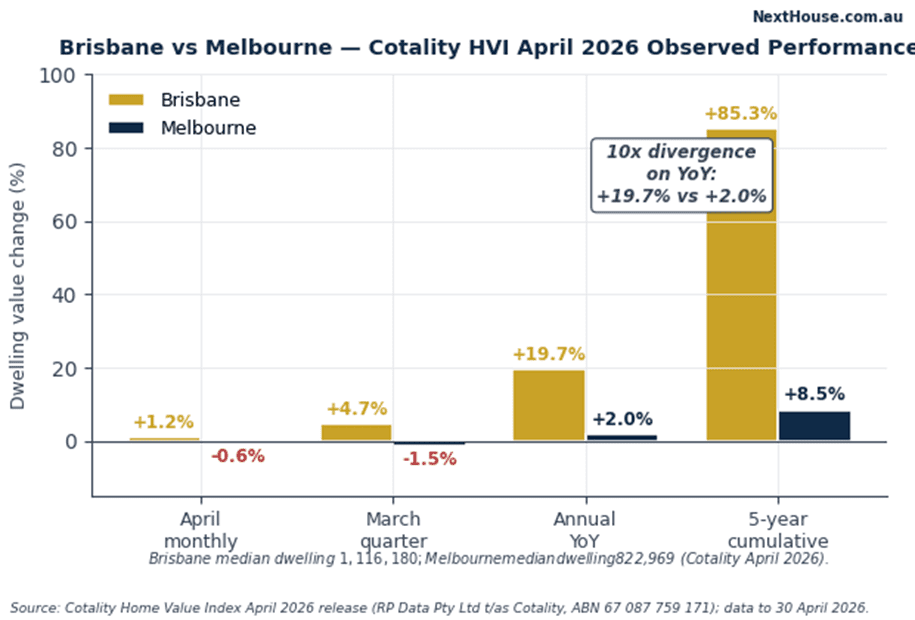
Brisbane vs Melbourne: Cotality April 2026 Snapshot
| Indicator | Brisbane | Melbourne | Brisbane premium |
| Median dwelling value | $1,116,180 | $822,969 | +$293,211 |
| Median house value | $1,222,906 | $972,734 | +$250,172 |
| Median unit value | $876,474 | $641,690 | +$234,784 |
| April 2026 monthly change | +1.2% | -0.6% | +1.8pp |
| March quarter change | +4.7% | -1.5% | +6.2pp |
| Annual year-on-year change | +19.7% | +2.0% | +17.7pp |
| 5-year cumulative change | +85.3% | +8.5% | +76.8pp |
Any analysis still anchored to “Brisbane is cheaper than Melbourne” is working from data that’s at least three years stale and about $250,000 wrong. This matters enormously for investors because the entire Brisbane bull case for the past three years was built on that pricing discount. The discount is gone.
The 22-Year Ratio Nobody Is Talking About
This is the most important chart in this whole article.
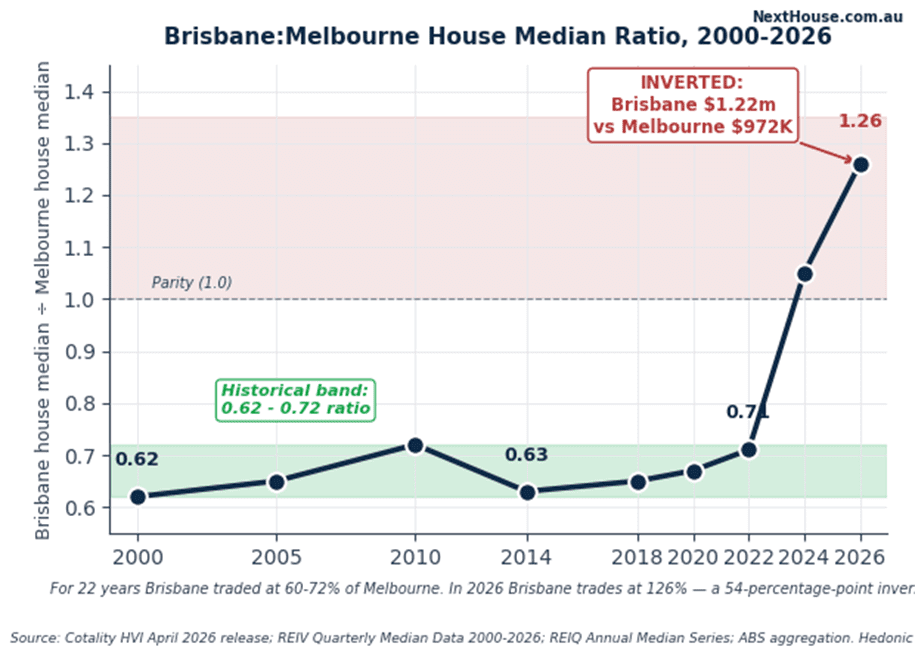
The relationship was stable across multiple property cycles. Multiple interest rate environments. Multiple demographic shifts. The April 2026 reading: 1.26.
Brisbane is now trading at a 26% premium to Melbourne on house values. The historical mid-band was 0.67. The swing from mid-band to current is 54 percentage points — the largest two-city ratio movement in modern Australian property data.
Why does this matter for your investment decision?
For the ratio to return to even a modest 0.85 normalisation level — still well above the historical average — one of these things has to happen over the next decade. Brisbane falls roughly 28% against an unchanged Melbourne. Or Melbourne rises roughly 26% against an unchanged Brisbane. Or some combination of both.
ANZ’s own 2027 forecast already acknowledges this rotation — Brisbane from +9.7% to +1.4%, Melbourne from -1.7% to +2.9%. The question isn’t whether the convergence happens. It’s when.
What the Banks Are Actually Forecasting?
ANZ’s +9.7% Brisbane call for 2026 is the most bullish number out of any major Australian bank. Let’s put it in context.
Big-4 Bank Forecasts for Brisbane and Melbourne 2026
| Bank | Brisbane 2026 | Brisbane 2027 | Melbourne 2026 | Melbourne 2027 |
| ANZ | +9.7% | +1.4% | -1.7% | +2.9% |
| Westpac | ~+7% | Moderating | Negative | Recovering |
| NAB | Mid-single digit | — | Flat to negative | — |
| CBA | ~+5% combined capitals | — | Similar to Westpac | — |
Source: ANZ bluenotes April 2026 (Boyton/Dunk); Westpac Housing Pulse December 2025; NAB Housing Monitor April 2026; CBA Economic Insights February–March 2026.
ANZ is the outlier. And there’s something worth noting about ANZ’s own numbers — they revised their combined-capitals forecast down from 4.8% to 2.8% in the same release they published +9.7% Brisbane. The macro view is softening even as the Brisbane city view stays elevated.
The track record also matters. The major banks unanimously under-forecast 2025 Brisbane (consensus ~+8%, outturn +14.6%) and broadly over-forecast 2025 Melbourne. In late-cycle markets, that pattern tends to reverse.
The Observed Data — What’s Actually Happening Right Now?
The supply-shortage story that has underwritten Brisbane’s bull run (PropTrack April 2026). And SQM Research’s April 2026 data puts Brisbane vacancy at 0.8% — tight, yes, but Melbourne’s 1.4% is also tightening fast, down from 2.0% just six months ago (SQM Research National Vacancy Rate April 2026).
Melbourne is falling at the aggregate level — -0.6% in April, -1.5% over the March quarter, now 2.3% below its March 2022 absolute peak (Cotality May 2026 commentary). But that aggregate number is hiding a bifurcation that matters enormously for investor decisions.
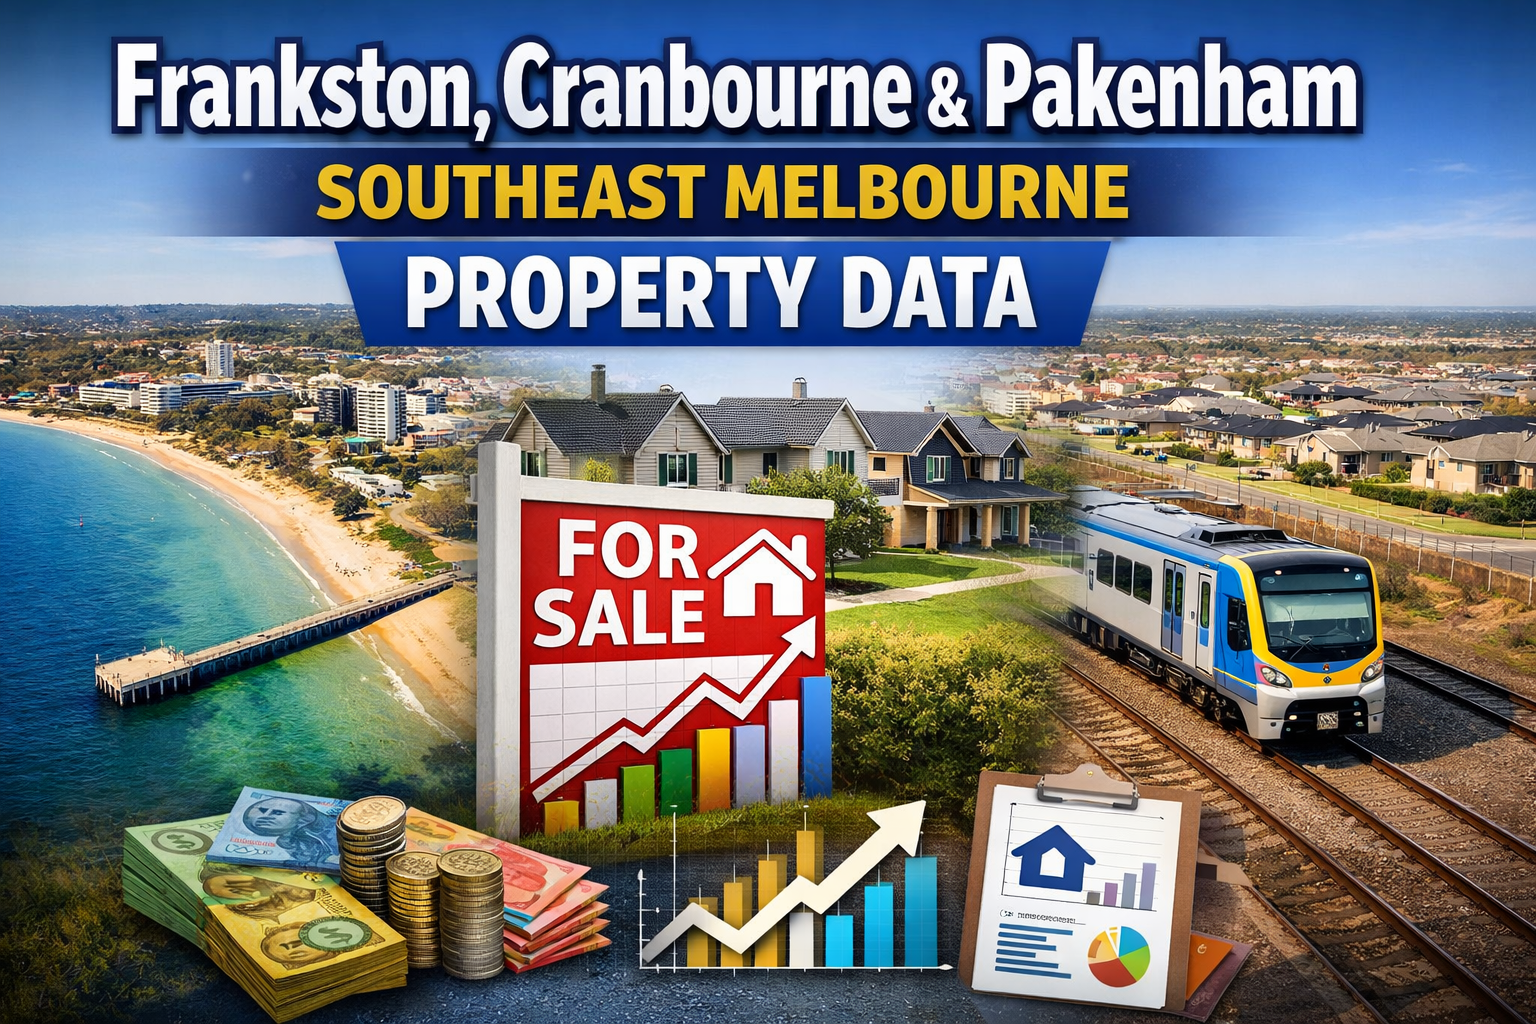
Meanwhile, the outer corridors are growing at 5–11% year-on-year. Frankston SA3: +11.3%. Keilor: +9.5%. Sunbury: +9.0%. Brimbank-West: +8.6%. Casey-South: +6.7%. Eight Melbourne SA3s are growing solidly while the Greater Melbourne aggregate prints negative (Cotality HVI April 2026).
The Corridor Story — Where to Actually Look in Each City?
Brisbane SE Corridor Medians and Growth
| Corridor | Median house | Annual YoY growth |
| Ipswich | $735,000 | +19.7% |
| Logan | $789,450 | +19% (LGA) |
| Moreton Bay | $852,750 | +17.6% |
| Redland | $950,000 | Strong |
| Beaudesert | $959,256 | +25.4% |
| Loganlea-Carbrook | $1,022,343 | +24.3% |
Source: REIQ Quarterly Market Monitor Q1 2026; Cotality HVI April 2026 SA3-level data.
The entry-tier corridors — Logan, Ipswich, outer Moreton Bay — still trade sub-$800,000 and are delivering 19–25% annual growth. These are the pockets where the Olympic infrastructure premium hasn’t yet been fully priced in. These are the Brisbane corridors worth serious attention.
Inner-ring Brisbane at $1.2 million-plus? That’s a different proposition. You’re paying the full premium for the bull thesis with limited remaining upside — and you’re hitting the APRA DTI cap at median income levels.
Melbourne Outer: Where the Mean-Reversion Play Lives
Melbourne Outer Corridor SA3 Medians and Annual Growth
| SA3 | Median dwelling | Annual change |
| Frankston SA3 | $851,755 | +11.3% |
| Keilor | $1,071,764 | +9.5% |
| Sunbury | $747,417 | +9.0% |
| Brimbank-West | $729,315 | +8.6% |
| Tullamarine-Broadmeadows | $745,469 | +7.5% |
| Casey-South | $816,712 | +6.7% |
| Cardinia | $792,730 | +6.6% |
| Whittlesea-Wallan | $783,013 | +5.9% |
| Wyndham | $712,277 | +5.2% |
Source: Cotality Home Value Index April 2026 SA3-level data.
Eight Melbourne outer-corridor SA3s are growing at 5–11% year-on-year. Sub-$850,000 medians. The DTI cap new-dwelling exemption applies to master-planned estates here.
The Stamp Duty Reality — $19,745 in Your Pocket
On a $700,000 investor property purchase, Queensland stamp duty is $17,325. Victorian stamp duty is $37,070. That’s a $19,745 difference — before you’ve made a single mortgage payment (Queensland Revenue Office; State Revenue Office Victoria, 2025–26 schedules).
Table 5 — Stamp Duty Comparison: Investor Purchase
| Purchase price | QLD investor duty | VIC investor duty | Brisbane advantage |
| $500,000 | ~$9,000 (1.80%) | ~$25,070 (5.01%) | +$16,070 |
| $700,000 | $17,325 (2.48%) | $37,070 (5.30%) | +$19,745 |
| $1,000,000 | $38,025 (3.80%) | $55,000 (5.50%) | +$16,975 |
| $1,500,000 | $58,025 (3.87%) | $82,500 (5.50%) | +$24,475 |
Source: Queensland Revenue Office general transfer duty schedule 2025–26; State Revenue Office Victoria general transfer duty schedule 2025–26.
The ongoing gap matters more. Victoria runs one of the heaviest property tax regimes in the country: a Vacant Residential Land Tax that escalates from 1% to 3% on capital improved value, a 4% absentee owner surcharge, an 8% foreign purchaser additional duty, and a $50,000 land tax threshold — the lowest in Australia, meaning almost every investment property in Victoria triggers land tax (SRO Victoria current schedules).
Add it up over five years and the structural advantage to Brisbane is roughly $30,000 ahead of any yield or growth differential. That’s real money — and it doesn’t change with cash rate settings.
Watch: The $500K Reversal: Why Brisbane Just Lost to Melbourne
The Cashflow Maths — Neither City Is Pretty at 6.26%
At the post-May 2026 average new variable mortgage rate of approximately 6.26% (Canstar, May 2026), here’s the honest cashflow picture on a $700,000 investor purchase in both cities.
Cashflow at 6.26%: $700K Investor Purchase
| Item | Brisbane house | Melbourne outer house |
| Purchase price | $700,000 | $700,000 |
| Stamp duty (investor) | $17,325 | $37,070 |
| Loan (80% LVR) | $560,000 | $560,000 |
| Annual interest cost @ 6.26% | $35,056 | $35,056 |
| Gross annual rent | $24,500 | $24,500 |
| Ongoing costs (rates, insurance, mgmt, land tax) | $7,000 | $9,500 |
| Net rent after costs | $17,500 | $15,000 |
| Annual pre-tax cashflow deficit | -$17,556 | -$20,056 |
| Brisbane annual cashflow advantage | — | +$2,500 |
Illustrative model only. Not financial advice. Source: NextHouse model; Canstar May 2026; Aussie Home Loans April 2026.
Brisbane’s annual cashflow advantage over Melbourne outer-corridor is about $2,500 per year — roughly $208 per month. Over five years, that accumulates to $12,500. Real, but not the dramatic yield gap that gets talked up in the property commentary.
The popular “Brisbane yields are 1% higher” line doesn’t translate to $7,000 per year in the real world once you account for different state-tax costs. The actual after-cost differential is closer to 0.4 to 0.7 percentage points.
The 10-Year Scenarios — Two Cities, Two Very Different Stories
This is where the investment decision really gets interesting.
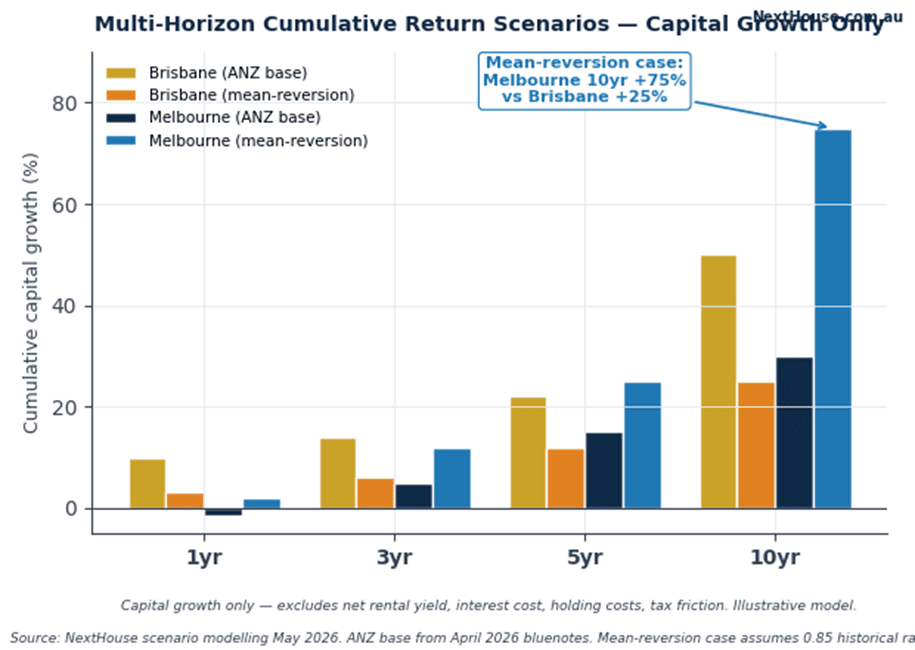
Multi-Horizon Capital Growth Scenarios (Illustrative)
| Horizon | Brisbane (ANZ base) | Brisbane (mean-reversion) | Melbourne (ANZ base) | Melbourne (mean-reversion) |
| 1 year | +9.7% | +3% | -1.7% | +2% |
| 3 years | +14% | +6% | +5% | +12% |
| 5 years | +22% | +12% | +15% | +25% |
| 10 years | +50% | +25% | +30% | +75% |
Illustrative model only. Source: NextHouse scenario modelling May 2026; ANZ base from April 2026 bluenotes; mean-reversion case assumes 0.85 historical ratio normalisation over 10 years. Capital growth only — excludes net rental yield, interest cost, holding costs, tax. Not financial advice.
The 10-year difference between those two Melbourne scenarios is approximately $250,000 on a $1 million purchase. That’s not a rounding error. That’s the house price argument turning completely on its head.
Which scenario plays out depends on two things: how much of the Brisbane premium is structural versus cyclical, and how long it takes the ratio to mean-revert. ANZ’s own 2027 forecast (+1.4% Brisbane, +2.9% Melbourne) is already pointing toward the rotation. The timing is in dispute. The direction is not.
The APRA Debt Cap — And Why It Now Bites Brisbane?
From 1 February 2026, APRA limits lenders to 20% of new mortgage lending at a debt-to-income ratio of 6× or above (APRA Information Paper, December 2025). The cap is quarterly, per bank, applied separately to investor and owner-occupier books.
Here’s how it plays out at each city’s median. A household earning $160,000 breaches at 6.11×. Median-income Brisbane borrowers are now inside the restricted 20% bucket. They need lender-by-lender quarterly approval.
At Melbourne’s $972,734 house median, the same $170,000 income household has a DTI of 4.58×. Well below the cap. No issue. This is a structural regulatory wedge that wasn’t there in 2022 or 2023. Brisbane’s price run has pushed it into the zone where the DTI cap becomes a genuine constraint for the marginal buyer — and the marginal buyer is who sets the price.
The 2032 Olympics — Priced In or Still Running?
If that pattern holds, the biggest Olympic effect for Brisbane is yet to come — but it comes after 2032, not before it. The honest read on Olympic pricing: inner-ring Brisbane has already priced it. The Ipswich, Logan, and outer Moreton Bay corridors — where medians still sit sub-$800,000 — have not fully priced it yet. That’s where the remaining upside lives.
Risk note: Cross River Rail has already blown out from $5.4 billion to $17 billion+ and been delayed to 2029. Infrastructure delivery risk is real. Olympic hosts don’t always deliver on the economic promise — Sydney 2000 modelling from Monash University showed the Games cost NSW households approximately $420 each in net terms.
Migration — Melbourne Wins on Volume, Brisbane Wins on the Marginal Buyer
Overseas migrants often arrive in capital-city rental markets first. Interstate migrants — who are already established, typically have more equity and savings, and are making a deliberate lifestyle or investment decision — are more likely to enter the purchase market quickly. Queensland’s interstate migration dominance means a stronger near-term buyer pool.
The long run favours Melbourne. The Centre for Population 2025 statement projects Melbourne to reach 9.1 million by 2065-66, and Victorian net interstate migration is projected to turn slightly positive from 2026–27 onwards. Melbourne’s absolute population additions, driven by overseas migration and natural increase, ensure sustained long-run housing demand.
Bull Case and Bear Case — Both Cities, Straight Up
Brisbane — Reasons to Be Bullish
- Queensland interstate migration dominance. +19,092 to +21,595 net interstate arrivals in 2024–25 — more than twice any other state. These are active near-term property buyers, not just renters.
- Queensland-specific demand concentration. 89% of Queensland survey respondents expect property price rises in 2026 — highest of any state (Cotality Decoding 2026, January 2026). Brisbane is the number-one Australian capital city for 10-year cumulative growth at +119.5% (Cotality April 2026).
Brisbane — Reasons to Be Cautious
- ANZ itself forecasts collapse to +1.4% in 2027. The bank making the most bullish 2026 call explicitly forecasts Brisbane to underperform Melbourne in 2027. Even ANZ is pricing in the turn.
- The yield advantage has basically disappeared on houses. Brisbane houses yield approximately 3.4% gross — barely above Melbourne’s 3.2%. The structural yield edge that anchored the 2021–2024 bull case is now immaterial.
- APRA DTI cap bites at $1.22 million medians. Median-income borrowers in Brisbane are now touching the 6× cap. Non-bank lenders absorb some volume but at higher margins. Access to credit for the marginal buyer is structurally tighter.
- Olympic delivery risk is real. Cross River Rail has already blown out to $17 billion+ and delayed to 2029. Brisbane’s 2032 budget is roughly one-third of Rio’s and one-third of London’s. Monash University modelling showed Sydney 2000 delivered net negative economics for NSW households.
Melbourne — Reasons to Be Bullish
- The 54-point ratio inversion has to unwind. The Brisbane:Melbourne ratio at 1.26 is 54 percentage points above the 22-year historical mid-band. Even partial reversion to 0.85 delivers Melbourne outperformance over the 10-year horizon. ANZ’s own 2027 forecast implies the rotation has already started.
- Outer corridors are already delivering 5–11% growth. Eight SA3s are growing solidly while the Melbourne aggregate prints negative. The bifurcation thesis is alive (Cotality HVI April 2026).
- Sub-$850,000 houses are still available in outer corridors. Melbourne outer-corridor SA3 medians run from $712,000 to $852,000 — comparable to Brisbane SE entry-tier at $735,000 to $1,022,000, but without Brisbane’s APRA DTI pressure at city-level medians.
- Double regulatory tailwind on new dwellings. APRA DTI cap new-dwelling exemption plus Victorian off-the-plan stamp duty concession (extended to 21 April 2027) — approximately $28,000 saving on a typical $620,000 apartment plus DTI cap bypass. No equivalent double benefit in Brisbane.
Melbourne — Reasons to Be Cautious
- Observed declines are now running. -0.6% April 2026, -1.5% Q1 2026, now 2.3% below the March 2022 peak (Cotality HVI April–May 2026). The near-term data is not your friend.
- Heaviest property tax burden in Australia. Vacant Residential Land Tax at 1–3% on capital improved value. Absentee owner surcharge 4%. Land tax threshold $50,000 — lowest nationally. The state-tax drag on net yields is real and structural.
- Inner-east upper quartile correction is ongoing. Upper-quartile Melbourne -1.9% in Q1 2026 alone. Prestige and inner-city apartments showing steepest declines. Avoid the top segment if you’re looking for capital growth momentum.
NextHouse View
For a yield-focused investor at 4.35% RBA cash rate: Brisbane still wins on cashflow — but the margin is about $2,500 per year, not the dramatic number that gets sold. Enter via entry-tier corridors — Logan-Beaudesert, Ipswich, outer Moreton Bay — that still trade sub-$800K and have the Olympic infrastructure runway ahead of them. Buy new where possible to capture the APRA DTI exemption.
For a long-horizon contrarian investor with a 5-to-10-year view: Melbourne wins on the mean-reversion thesis. The Brisbane:Melbourne ratio at 1.26 is the largest two-city ratio distortion in modern Australian data. Even partial normalisation to 0.85 delivers Melbourne outperformance. The best entry is the outer corridor SA3s growing at 5–11% year-on-year, purchased as new dwellings to capture both the off-the-plan concession and the APRA DTI exemption.
Neither city is cheap. Both are structurally negative cashflow at 4.35% — interest of roughly $35,000 per year exceeds gross rent of roughly $24,500 on a $700K purchase in both cities. Budget for the shortfall. Plan for the long game.
FAQ
- What’s Brisbane’s median house price right now?
Brisbane just keeps climbing. The median house price hit $1.22 million in April 2026 — up almost 20% in a single year. If you bought five years ago, your home is worth 85% more today. Wild. - What about Melbourne?
Melbourne’s been the quiet one at the table. At just under $973K, it’s still playing catch-up to where it was back in early 2022 — over four years ago. Prices have come back, sure, but it’s been a slow crawl. No boom, no buzz — just steady recovery while Brisbane grabbed all the headlines. Whether that makes it a hidden opportunity or just a slower market depends on who you ask. - Does the new APRA borrowing cap hurt Brisbane buyers more?
Honestly, yes. Brisbane’s prices have climbed so high that average earners are now hitting the ceiling on what they’re allowed to borrow — six times their income. Melbourne buyers at the median still have a little wiggle room. The one upside? If you’re buying a new build, you’re off the hook — the cap doesn’t apply to construction loans in either city. - How does stamp duty compare on a $700K purchase?
This one’s pretty eye-opening. Buy in Brisbane and you’re paying $17,325 in stamp duty. Buy the same property in Melbourne and it’s $37,070. - Which Melbourne suburbs are growing fastest?
Frankston is leading at +11.3% growth over the past year, with Keilor, Sunbury, and Brimbank-West all close behind. If you got into any of these areas a year ago, you’re feeling pretty good right now. - Can you still find value in Brisbane’s outer suburbs?
Yes, and it might surprise you how much. All well under $900K, yet still pumping out 17–25% growth a year. When Brisbane’s median is sitting at $1.22 million, these areas feel like a completely different city. If you’re a first-timer stretched on budget, or an investor trying to make the numbers work, it’s pretty hard to look past them.
Related Reading
- Werribee Property Market 2026: Why the Wyndham SA3 Underperforms Every Outer-Melbourne Peer
- Tarneit Property Market 2026: Why the PSP and Builder Matter More Than the Suburb
- Frankston Property Market 2026: Why the Mornington Peninsula Corridor Led Greater Melbourne (+11.3%)
- RBA Hikes Cash Rate to 4.35% (5 May 2026) — Melbourne Bifurcation Reactive
- APRA DTI Cap Activation: Impact on Australian Property Investors (1 February 2026)
- Armadale WA 2026: Has the Second Wave Already Crested?
- NextHouse Free Reports — quarterly suburb intelligence
References
- Westpac Housing Pulse December 2025.
- NAB Housing Monitor April 2026.
- CBA Economic Insights February–March 2026
- REIQ Quarterly Market Monitor Q1 2026 — SE Queensland corridor medians.
- SQM Research National Vacancy Rate April 2026 — Brisbane 0.8%, Melbourne 1.4%.
- APRA, “Activating debt-to-income limits as a macroprudential policy tool” (Information Paper, December 2025; letter to ADIs 27 November 2025) — 20% cap on DTI ≥6× from 1 February 2026; new-dwelling construction loans EXEMPT.
- Queensland Revenue Office, General Transfer Duty Schedule 2025–26.
- State Revenue Office Victoria, General Transfer Duty Schedule 2025–26.
- Reserve Bank of Australia, MR-26-12, 5 May 2026 — cash rate 4.35%.
- Canstar Home Loan Index May 2026 — average new variable rate ~6.26%.
- Monash University, Olympic economic modelling — Sydney 2000 net negative for NSW households (~$420 per household).
- Centre for Population 2025 statement — Melbourne projected 9.1 million by 2065–66.
Disclaimer
This article is produced by NextHouse.com.au for general information and educational purposes only. It is not financial product advice, mortgage advice, tax advice, real estate advice or legal advice. NextHouse is not licensed to provide personal financial advice. All cashflow modelling, stamp duty comparisons, scenario projections, and yield calculations are illustrative models at stated assumptions. Actual outcomes vary materially by lender, loan structure, individual income, tax position, state-tax regime, APRA settings, and market conditions. Forecasts cited from ANZ, Westpac, NAB, CBA, and Cotality are projections only — not observed data.
NextHouse does not accept paid placement from developers, agents, lenders, builders or any third party referenced in this article. All analysis is independent.