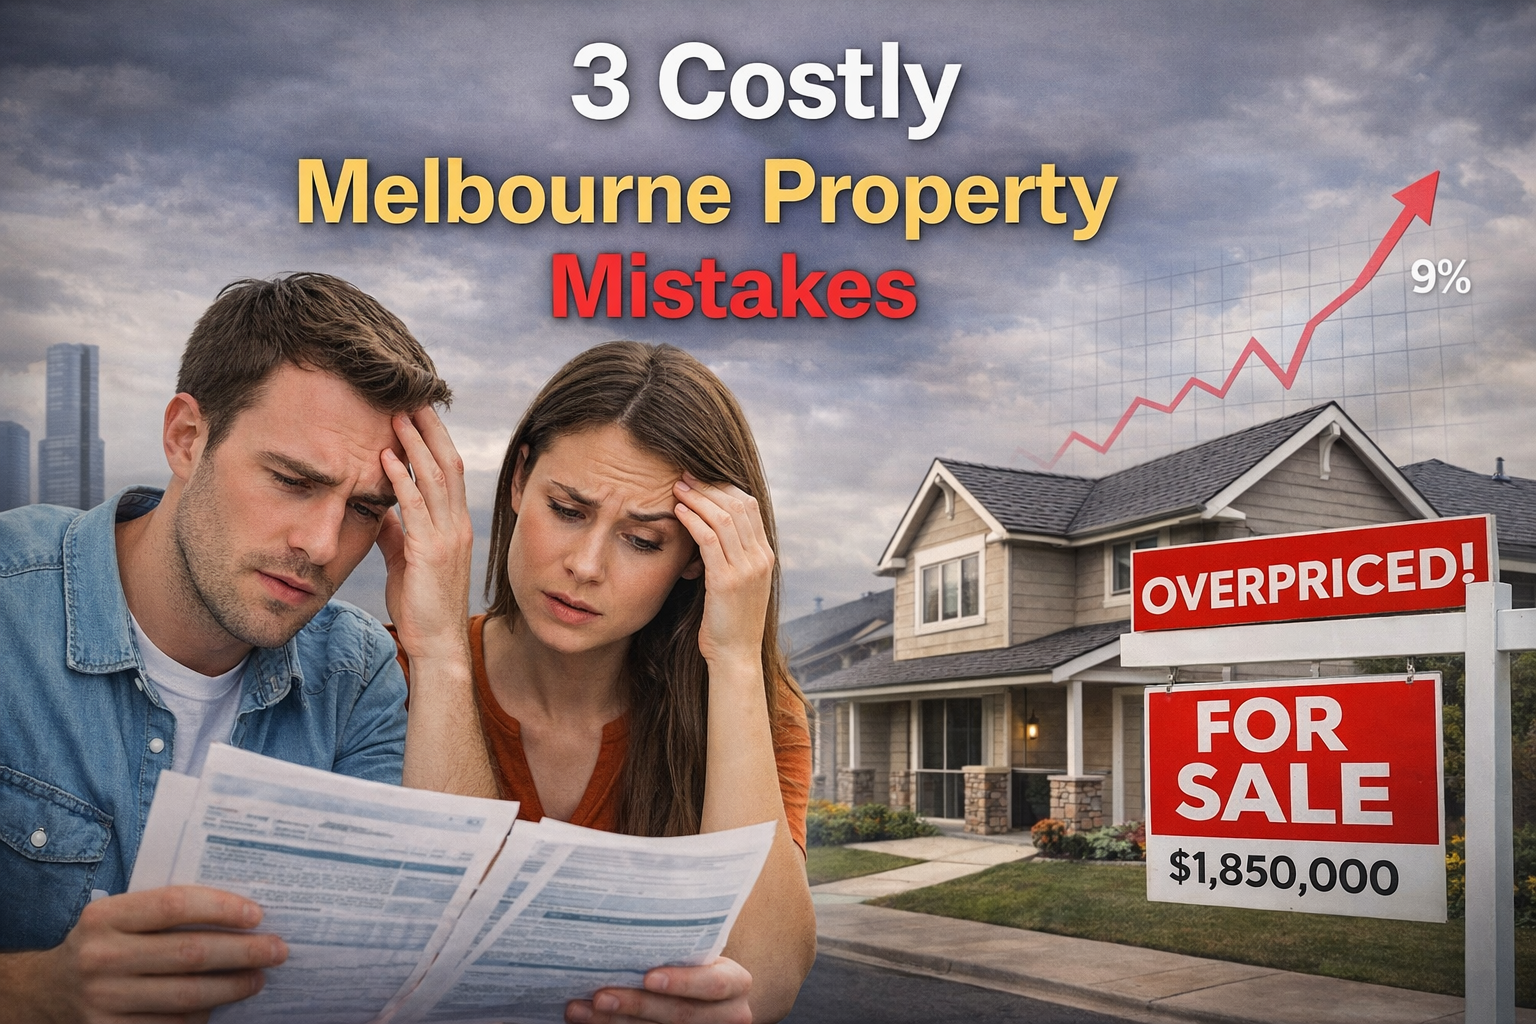
Buying property in Melbourne right now is confusing — and honestly, that’s putting it mildly. Rates went up again. Prices are still climbing. And everyone in your life has a loud opinion about what you should do. Your uncle reckons it’s all about to crash. Your broker says you’re already too late. And that guy on Reddit has been calling a collapse every single year since 2019. Below is the breakdown of what is happening with the Melbourne property market and Melbourne property mistakes for investors to avoid.
It’s a lot. And somewhere in all that noise, most buyers quietly make one — or all three — of the decisions that end up costing them a fortune. Not because they were reckless. Not because they got unlucky. But because the decisions felt completely reasonable at the time.
We’re not talking about obvious blunders like buying a flood-prone dud or getting swept up at auction. We’re talking about sensible-looking choices. Choices that hundreds of Melbourne buyers make every single month.
What Does Melbourne Property Actually Do?
Melbourne’s median house price was roughly $38,000 in 1980. Today it sits at $977,579 (Cotality HVI, February 2026). That’s a compound annual growth rate of about 7.2% over 45 years — straight through the early 90s recession, the GFC, a global pandemic, multiple rate hike cycles, and roughly ten thousand headlines predicting imminent collapse.
| Year | Median House Price | What Was Happening |
| 1980 | ~$38,000 | Baseline |
| 2000 | ~$200,000 | +426% in 20 years |
| 2014 | ~$649,000 | Post-mining boom |
| 2026 | $977,579 | Cotality HVI, Feb 2026 |
| Long-run CAGR | ~7.2% | 45-year average |
An $800,000 house bought today, growing at Melbourne’s long-run average of 6.5% per year, becomes roughly $1.5 million in 10 years. In 20 years, it’s sitting close to $2.8 million.
The machine works. It has always worked. The question is whether you’re making decisions that put you inside it — or ones that keep you standing outside watching other people build wealth.
Mistake #1: Buying an Apartment Instead of a House in Melbourne Property
This is the big one. And it’s the one that catches the most well-meaning buyers — usually people who are genuinely trying to do the right thing, stretching their budget to get a foot in the door.
If an apartment feels like your sensible compromise right now, please read this part carefully. The gap between how houses and apartments perform in Melbourne property isn’t just noticeable anymore. It’s a genuine chasm — and it’s getting wider every year.
Over the decade to March 2025, national house values rose 80.2%. Apartments? A measly 37.7% (Cotality Pain & Gain Report, June 2025). Houses delivered more than double the capital growth over the same period.
In Melbourne right now, houses grew 6.5% in the year to January 2026 while units crept along at just 2.7% (Cotality via OpenAgent). Houses are outgrowing apartments at 2.4 times the rate.
Here’s what that actually looked like in dollars for two buyers who both got into Melbourne in 2014:
| Buyer | Purchase Price (2014) | Value (2025) | 10-Year Gain |
| House buyer | $649,000 | ~$924,000 | $275,000 |
| Unit buyer | $503,000 | ~$635,000 | $132,000 |
| The difference | — | — | $143,000 more for the house buyer |
Same city. Same decade. One buyer walked away with $143,000 more — purely because of the asset type they chose on the day they signed the contract.
The Bit Nobody Really Wants to Hear
Here’s where it gets worse. It’s not just that apartments grow more slowly. A significant number of them are actually going backwards.
In Melbourne right now, 22.5% of apartment resales are recording a nominal loss — meaning real people are selling for less than they originally paid (Cotality Pain & Gain, June 2025). For houses? Just 4.5%. Apartments are five times more likely to lose money on resale.
In the CBD, Docklands, and Southbank — the postcode everyone thinks of when they picture a “Melbourne investment apartment” — it’s genuinely catastrophic. Nearly 47% of all dwellings sold in the City of Melbourne LGA went for less than the purchase price.
| Metric | Houses | Apartments |
| 12-month growth (Jan 2026) | +6.5% | +2.7% |
| 10-year national growth | +80.2% | +37.7% |
| % selling at a loss (Mar 2025) | 4.5% | 22.5% |
| City of Melbourne LGA loss rate | — | ~47% |
| Annual owners corp fees | $0 | $4,000–$10,000+ |
| Bank LVR cap (CBD postcodes) | Up to 95% | 70–80% only |
So Why Does This Keep Happening in Melbourne property market?
When you buy a house, you own actual ground in a city that physically cannot make more of it. That scarcity builds on itself every single year.
When you buy into a 200-unit CBD tower, you own a thin slice of a building that’s aging, getting more expensive to maintain, and sitting in a sea of nearly identical alternatives. Right now there are 8,000 unsold newly-built apartments on the Melbourne market — 17% of everything completed between 2020 and 2024 (Charter Keck Cramer, 2025). That glut keeps pushing resale values down whether you’re watching or not.
The land under a house in a middle-ring suburb is irreplaceable. The airspace above a CBD block is not.
Mistake #2: Buying in the Wrong Suburb
Most buyers think about location in terms of lifestyle as in cafés, schools, commute time. But there’s a whole other dimension that quietly determines whether your suburb outperforms the market or drags behind it for a decade.
That dimension is infrastructure. And Melbourne right now is in the middle of the biggest infrastructure transformation in its entire history.
Over $100 billion is being spent reshaping this city — new rail lines, underground stations, level crossing removals, hospital precincts, and planning reforms that will completely change the growth trajectory of specific suburbs. Most buyers are walking straight past all of it.
The academic research on infrastructure and property prices is not ambiguous. It’s documented. It’s peer-reviewed. It’s consistent.
| Project | Location | Price Uplift | Source |
| Mernda Rail Extension | Mernda | 8.7% premium within 800m | Zhang & Shukla (2023), RMIT |
| Level Crossing Removal | Glen Iris | 28.6% house price uplift | Liang, Koo & Lee (2021), Deakin/UNSW |
| Level Crossing Removal | Bayswater | 8.8% uplift | Liang, Koo & Lee (2021) |
| Metro Tunnel (opened Feb 2026) | Arden, Parkville, South Yarra | Ongoing post-opening uplift | Forge Property 2025 |
| Rail/LXR analysis (Melbourne-wide) | Multiple suburbs | 4–7% uplift | Victorian Planning Authority |
The Metro Tunnel opened on 1 February 2026 — Melbourne’s biggest ever public transport investment at $13 billion, with five new underground stations and trains running every 3–4 minutes at peak. Suburbs along that corridor have been repricing for years. Some of them still haven’t finished repricing.
The Planning Reform Most People Have Completely Missed
In April 2025, the Victorian government locked in Amendment GC252 — designating 10 “pilot activity centres” for major housing development with new zoning, fast-tracked approvals, and a government target of 60,000 new homes. They’re locations where billions in infrastructure and government commitment are already in motion. The price premium that follows that kind of commitment? It hasn’t fully arrived yet.
| Suburb | Median House | 12-Mo Growth | Key Infrastructure | Why It Matters |
| Frankston | ~$730–$750K | +14.3% | GC252 + Metro Tunnel line + $562M hospital | #1 Melbourne growth suburb — 6 months straight |
| Broadmeadows | ~$585–$635K | +6–8% | GC252 + Craigieburn rail + Airport proximity | 36% below metro median — most underpriced |
| Sunshine | ~$796K | +9.6% | Metro Tunnel corridor + future Airport Rail hub | Entire western corridor transforming |
| Reservoir | ~$805K | +12.1% | Level crossings removed + dual rail lines | North Melbourne’s most improved corridor |
| Clayton | ~$700–$780K | +8.6–14.3% | SRL East station (excavation underway) | Generational infrastructure — literally being dug right now |
| Epping | ~$780K | +7–9% | GC252 + Northern Hospital expansion | Activity centre under $800K with hospital demand floor |
The research shows infrastructure premiums build progressively during construction — not just when a project opens. That exact same window exists right now in the SRL East corridor and GC252 precincts. The infrastructure is confirmed.
Mistake #3: Waiting for the “Right Time”
This is the most common mistake of the three because waiting doesn’t feel like a mistake. It feels like patience. It feels like caution. It feels like you’re being smart.
And in almost every stretch of Melbourne’s property history, it has cost buyers a tremendous amount of money.
“I’ll wait until rates come down.” “I’ll jump in after the next correction.” “I just need a bit more in the deposit.”
Completely understandable thoughts. Also thoughts that have cost Melbourne buyers hundreds of thousands of dollars, over and over again.
| Waiting Period | What It Cost | What Actually Happened |
| 2014 → 2016 | ~$160K–$180K lost | Median surged from ~$560K to ~$720K |
| 2019 → 2021 | ~$200K–$250K lost | COVID stimulus drove prices to $950K+ |
| 2020 → 2022 | ~$270K lost | 24% rise in 2021 alone |
| 2022 → 2024 | ~$85K saved | The one time waiting actually paid off |
| 2024 → 2026 | ~$120K+ estimated lost | Prices rose 4.5–8% despite rate chaos |
KPMG calculated in early 2026 that Melbourne property was rising by approximately $178 per day — around $65,000 per year. That’s not a sales pitch. That’s just the current growth rate divided by 365.
Every single day of waiting has a price. Most people just never do the maths on it.
Why “Waiting for Rate Cuts” Backfires Every Time
A lot of buyers right now are doing the same thing — watching the RBA, waiting for rate cuts, telling themselves they’ll move once things feel a bit more certain. Because here’s what actually happens every single time: by the time the cuts arrive, Melbourne property prices have already moved. They bottom out quietly, while everyone’s still nervous. Then the cuts hit, confidence floods back, and suddenly everyone wants in at the same time.
The people who waited for certainty didn’t buy at the bottom. They bought at the surge. Waiting for the all-clear doesn’t mean buying at the right time. It means arriving after the best prices are already gone.
The Deposit Trap — Why Saving Longer Puts You Further Behind
Here’s the part that genuinely stings. Disciplined. Consistent. Doing everything right. But that house is growing by $52,000 a year — more than double what you’re putting away. Four years of sacrifice. Further behind than when you started.
What the Major Forecasters Are Saying Right Now about Melbourne property
| Forecaster | 2026 Melbourne property Forecast | Basis |
| KPMG (Jan 2026) | +6.6% → ~$1,041,000 median | Undervaluation vs Sydney + supply gap |
| Westpac (Sep 2025) | +7–10% | Low supply, migration, cash buyers |
| PropTrack (late 2025) | +4–7% | Structural demand despite rate volatility |
| ANZ (Feb 2026) | +2.1% (revised down post-hike) | Affordability pressure |
Even the most cautious major bank forecast has Melbourne property going up. The range is 2.1% to 10%. Not one institution is calling a fall.
What Happens When All Three Mistakes Hit at Once?
Here’s the thing — these mistakes don’t just add up. They multiply each other.
Picture a buyer who waits two years, then buys an apartment in an outer suburb with no confirmed infrastructure coming. They’ve paid the compounding cost of sitting on the sidelines. They’ve locked themselves into an asset that grows at roughly half the rate of a house. And they’ve completely missed every documented infrastructure premium zone.
| Scenario | 10-Year Estimated Outcome |
| $800K house in infrastructure-rich suburb — bought today | ~$1,500,000+ |
| Waited 2 years, bought $650K apartment in outer corridor | ~$850,000–$900,000 |
| The gap | ~$500,000–$650,000 |
Half a million dollars. Not from one catastrophic decision. From three choices that each, individually, seemed perfectly reasonable at the time.
So What Do You Actually Do?
The data points clearly in one direction. Here it is without the noise:
| Decision | Wrong Move | Right Move | 10-Year Cost of Getting It Wrong |
| Asset type | High-rise apartment | A house — any house, for the land | $143,000+ capital growth gap |
| Location | Outer greenfield (Melton, Wyndham, Pakenham) | Activity Centre or SRL/Metro Tunnel corridor | Miss 5–15% infrastructure premium |
| Timing | Waiting for perfect conditions | Buy when you can service it | $65,000 per year in foregone growth |
| First home buyer grants | Leaving them on the table | Use every single scheme available | Forfeiting $50,000+ in real savings |
The Free Money Most First Home Buyers Don’t Fully Use
If you’re a first home buyer in Victoria, the government has put real money on the table right now:
- $10,000 First Home Owner Grant — for new homes up to $750,000
- Full stamp — on properties up to $600,000 (sliding concession to $750,000)
- 5% Deposit Scheme — no income caps, Melbourne price cap of $950,000 (from October 2025)
- Help to Buy shared equity — buy with just a 2% deposit on homes up to $950,000 (launched December 2025)
Together, eligible buyers can tap into over $50,000 in savings. These schemes exist right now. They have caps. They have expiry dates.
Final Thoughts
Melbourne property has compounded at roughly 7.2% per year for 45 years. It has bounced back from every correction. It has quietly built serious wealth for buyers who chose houses over apartments, who got into the right suburbs before the infrastructure finished, and who bought when they could — not when everything felt perfect.
The three mistakes in this piece aren’t exotic or unusual. They’re the default. They’re what happens when buyers follow the path of least resistance without looking at the data underneath it. The good news? Avoiding them doesn’t require timing the market, predicting the RBA, or having perfect information. It just requires knowing what the evidence actually says — and making decisions that point in the same direction.
Want to see which Melbourne suburbs tick all three boxes right now? The NextHouse suburb intelligence dashboard tracks infrastructure commitments, growth data, and rezoning activity across Greater Melbourne — updated every month.
Disclaimer: This report is for educational and informational purposes only. It does not constitute financial, investment, or legal advice. Always seek professional advice before making property decisions.